
Figure 4.
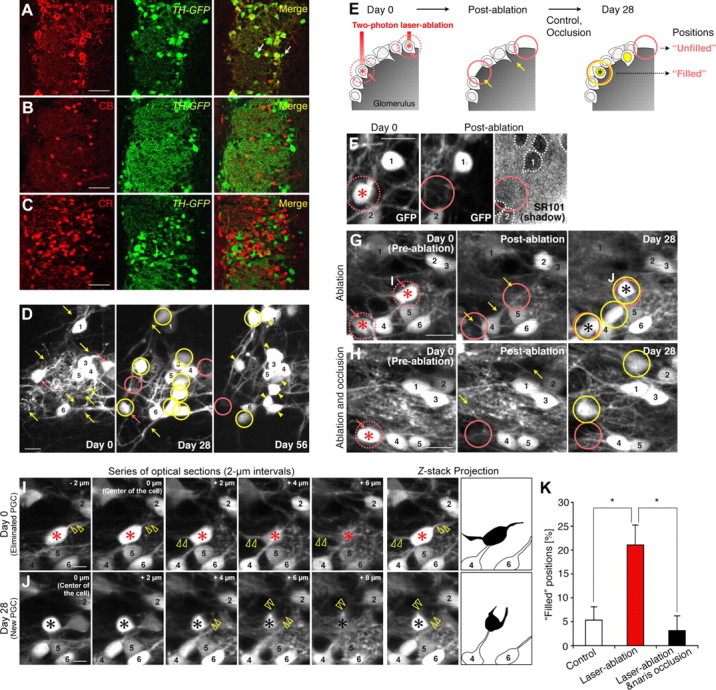
Olfactory-input-dependent recruitment of new DAergic PGCs into the positions of functional DAergic PGCs eliminated by laser ablation. A–C, GFP-expression pattern in the olfactory glomerular layer of TH-GFP mice. Coronal sections of the glomerular layer were stained for TH, CB, and CR (A–C, red). All of the TH+ PGCs (A), but none of the CB+ or CR+ PGCs (B and C, respectively) were labeled with GFP (green). A portion of the GFP+ PGCs did not express TH (A, white arrows). See also Table 1. D, In vivo repeated imaging of GFP+ PGCs in TH-GFP mice. Sequential images on days 0, 28, and 56 clearly show the stable (numbered), lost (pink arrows and circles), and added (yellow arrows and circles) PGCs in this area. E, Classification of the positions that had lost PGCs by laser ablation. PGCs labeled with a red asterisk were eliminated by laser ablation (E–J). Positions filled by new PGCs on day 28 are indicated by a black asterisk (E, G, J). F–H, Representative in vivo images showing the positions that had lost PGCs by laser ablation in TH-GFP mice. There was no SR101-negative “shadow” (white dashed circle) at the site of the ablated PGCs (F). Note that positions filled by new PGCs (black asterisks) were observed in the ablation group (G) but not in the ablation and occlusion group (H) in these areas (day 28). Single optical sections and their z-stack projection images of two PGCs in G are shown in I and J. I, J, Analysis of the dendrites of the eliminated DAergic PGCs and the newly added ones at the same positions. Series of single optical sections at 2 μm intervals (μm: z-axis distance from the center of the PGC) and z-stack projection images showed that the eliminated and new DAergic PGCs extended their primary dendrites in distinct directions (Z-stack Projection, black shadows). In contrast, PGCs observed to be stable (cell 4 and 6) did not change their dendritic direction throughout the imaging period. The yellow open arrowheads indicate the primary dendrites of targeted DAergic PGCs. K, Quantification of the positions filled by new PGCs on day 28. The percentage of filled positions in the ablation group (red) was significantly greater than in the control group (white) (*p < 0.05), and the increase was suppressed by a 4 week naris occlusion (black) (*p < 0.05). The pink circles indicate the territory of lost PGCs (D–H). Numbers in F–J indicate PGCs that were consistently observed throughout the experimental period. Scale bars: A–C, 50 μm, D, F–H, 10 μm; I, J, 5 μm. The data are presented as the mean ± SEM.