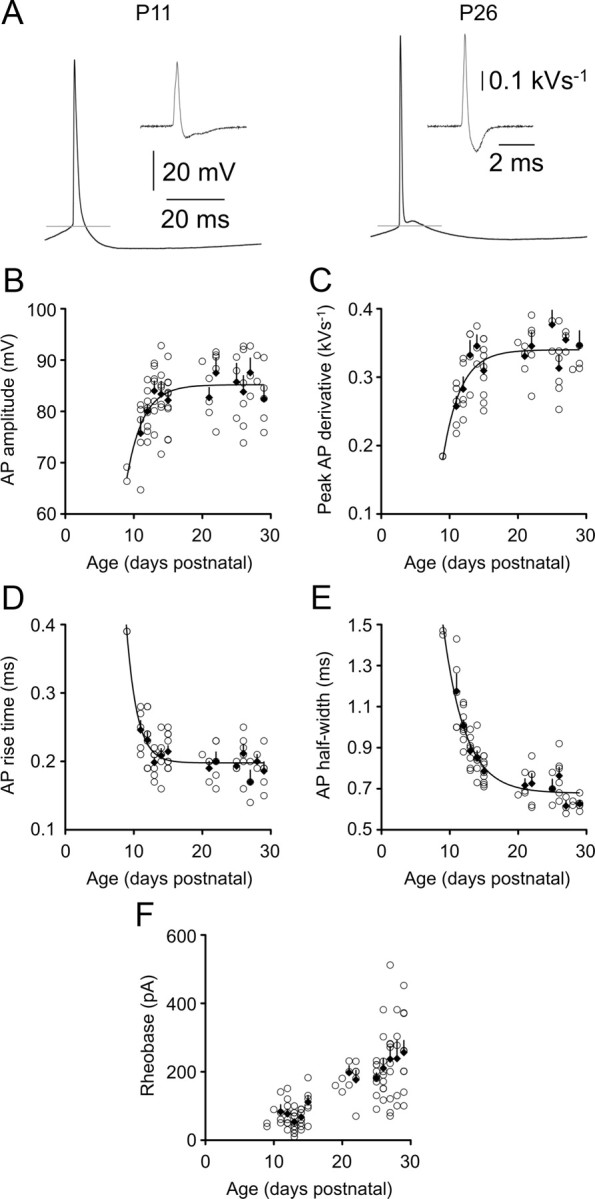
Figure 2.

Postnatal development of action potential properties. A, APs recorded in response to a rheobase current stimulus in P11 and P26 animals. Gray lines represent AP threshold, and insets show derivatives of the AP waveform. Calibrations refer to both left and right panels. B–F show the indicated action potential properties for individual layer 5 pyramidal neurons as a function of animal age. Filled diamonds are averages for each postnatal day. Error bars indicate SEM. In B–E, lines represent single exponential fits to the data.
