Figure 5.
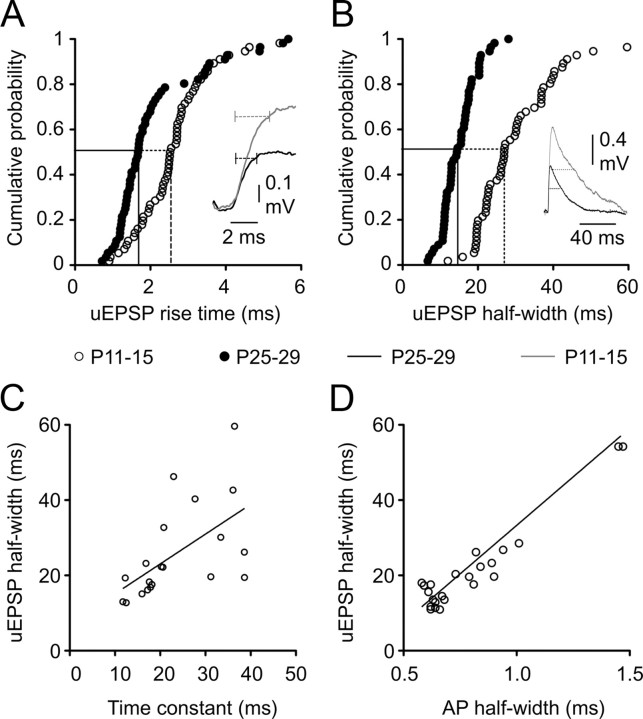
Postnatal development of uEPSP kinetics. A, B, Cumulative probability distributions for mean uEPSP rise time (A) and uEPSP half-width (B). Dashed drop lines indicate the developmental decreases in the median values. Insets in A and B are traces of representative uEPSPs from P11–P15 (gray traces) and P25–P29 (black traces) animals. Dashed horizontal lines in inset in A indicate a 10–90% rise time of uEPSPs. Dashed horizontal lines in inset in B indicate the half-width of uEPSPs. C, Relationship between uEPSP half-width and the membrane time constant of the postsynaptic neuron. Each data point represents an individual monosynaptic connection (r2 of linear regression line, 0.33; n = 20). D, Relationship between uEPSP half-width and the half-width of the presynaptic action potential showing a strong positive correlation (r2 of linear regression line, 0.67; n = 24).

