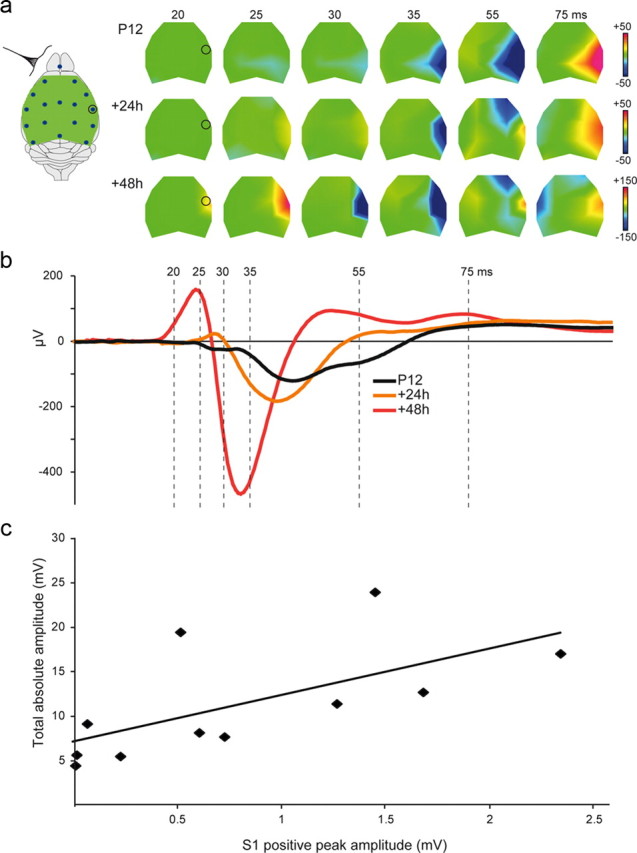
Figure 4.

A short-latency positive component appears between P12 and P14. a, Voltage maps at selected time points in response to left-sided whisker deflections recorded in the same animal at P12, P13, and P14. Color scaling in microvolts is indicated at each age. b, SEP waveforms recorded at each age from the electrode positioned above the parietal region contralateral to the stimulus (open circles in a). c, Correlation analysis in all P13 animals (n = 11) between the early parietal positive peak amplitude, calculated as the sum of the voltages recorded at the S1 electrode at each time bin across the duration of the positive component, and the total absolute activations at the electrodes located in the frontal area and in the parietal and frontal areas of the other hemisphere summated from 20 to 100 ms poststimulus. The linear regression line is illustrated (regression coefficient = 0.64).
