
Figure 6.
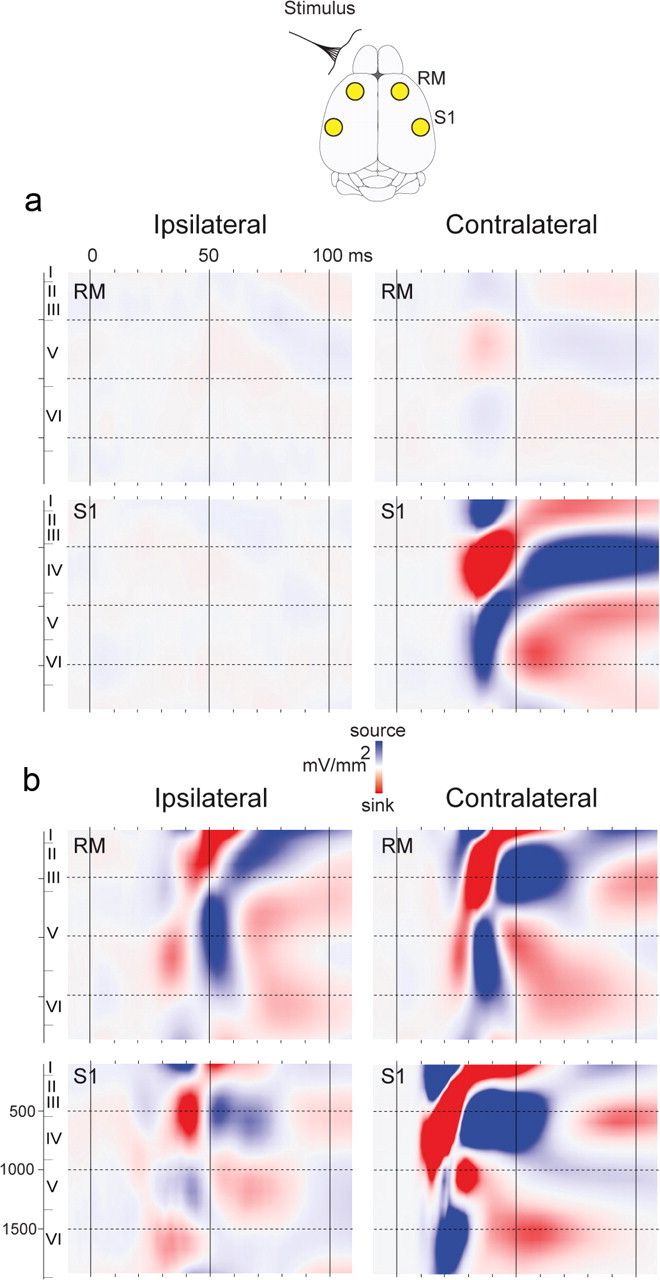
Current source-density analysis of intracortical responses to whisker stimulation at P10 and P21. a, b, Grand average current-source densities of 8 animals at P10 (a) and 8 animals at P21 (b) processed in the frontal and S1 regions in response to contralateral and ipsilateral stimulations. The color-coded scale is ± 80 mV/mm2. The y-axis conventions are as in Figure 5.