
Figure 7.
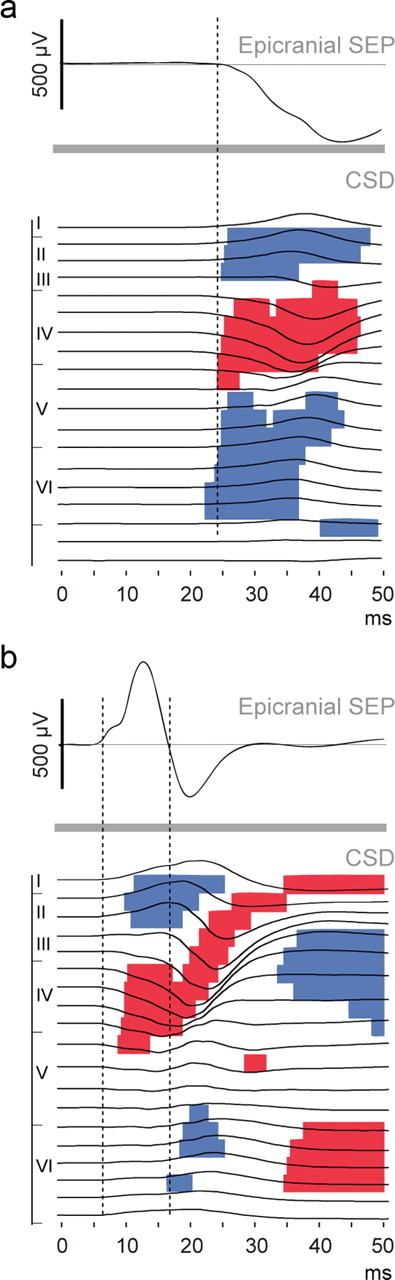
Correlation between epicranial SEPs and intracortical CSDs in S1 at P10 and P21. a, b, Colored segments indicate periods of significant evoked CSD signal at p < 0.01 at each electrode in P10 (a) and P21 (b) rats, superimposed on the CSD traces (point-wise paired t tests with Bonferroni corrections). Above each panel are presented the grand average SEPs recorded in the same rats (P10, n = 8; P21, n = 8). Dashed lines point to onsets and offsets of the first SEP components approximate from the grand average waveforms. The y-axis indicates the cortical layer borders.