
Figure 3.
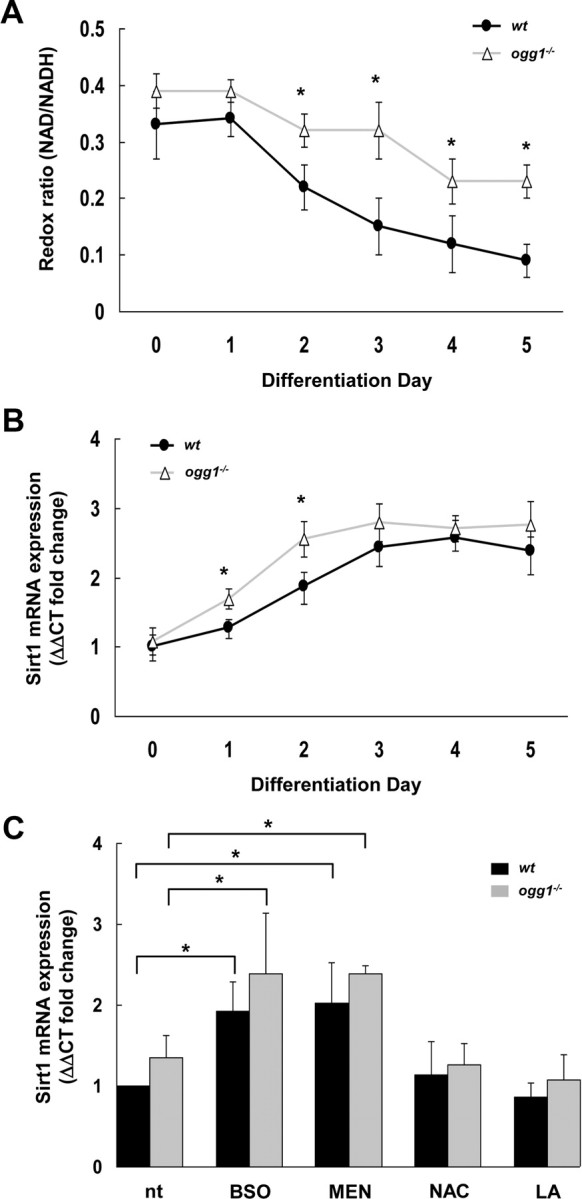
Altered redox levels and Sirt1 activation in ogg1−/− cells. A, Cellular redox levels were analyzed as NAD/NADH ratio in differentiation cells, as described in Materials and Methods. B, Sirt1 expression in cell cultures from wt and ogg1−/− NSC during differentiation. C, Redox manipulations correspondingly involve Sirt1. Sirt1 expression levels after treatment with oxidants [BSO and menadione (MEN)] and antioxidants (NAC and LA) were assessed by RT-PCR. All data are mean with SD from more than three independent experiments *p < 0.05.