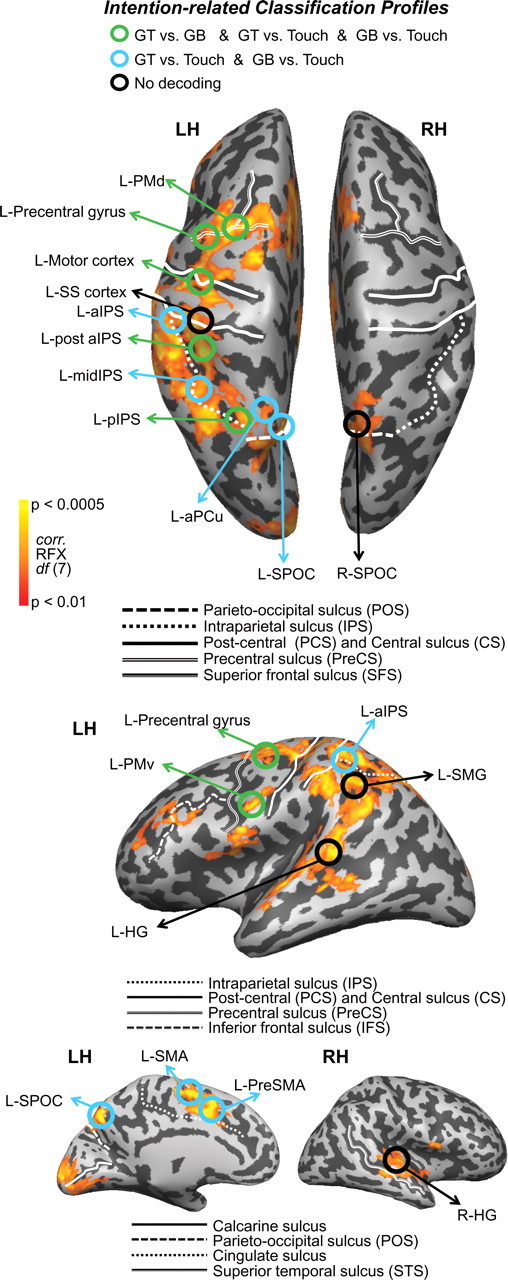
Figure 2.

Decoding of object-directed movement intentions across the parieto-frontal network. Cortical areas that exhibited larger responses during movement planning than the preceding visual phase (plan > preview) are shown in orange/yellow activation. Results calculated across all subjects (random-effects GLM) are displayed on one representative subject's inflated hemispheres. The general locations of the selected ROIs are outlined in circles (actual ROIs were anatomically defined separately in each subject). Each ROI is color coded according to the pairwise discriminations they can decode during the plan phase (found in Fig. 4); see color legend at top for classification profiles (colors denote significant decoding accuracies for upcoming actions with respect to 50% chance). Sulcal landmarks are denoted by white lines (stylized according to the corresponding legends below each brain). LH, Left hemisphere; RH, right hemisphere.
