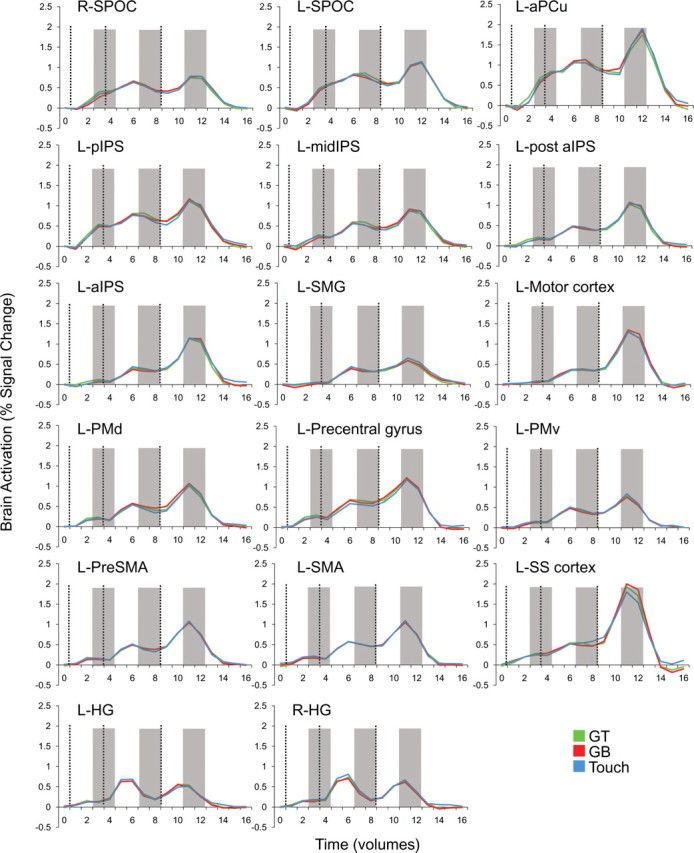
Figure 3.

Trial-related percentage signal change fMRI activations from each of the 14 plan-network ROIs and three sensory control ROIs. Activity in each plot is averaged across voxels within each ROI and across subjects. Plots show the profiles of typical preparatory activity found throughout parieto-frontal network areas. Vertical dashed lines correspond to the onset of the preview, plan, and execute phases of each trial (from left to right). Shaded gray bars highlight the two-volume (4 s) windows that were averaged and extracted for pattern classification analysis. Note that time corresponds to imaging volumes (TR of 2) and not seconds.
