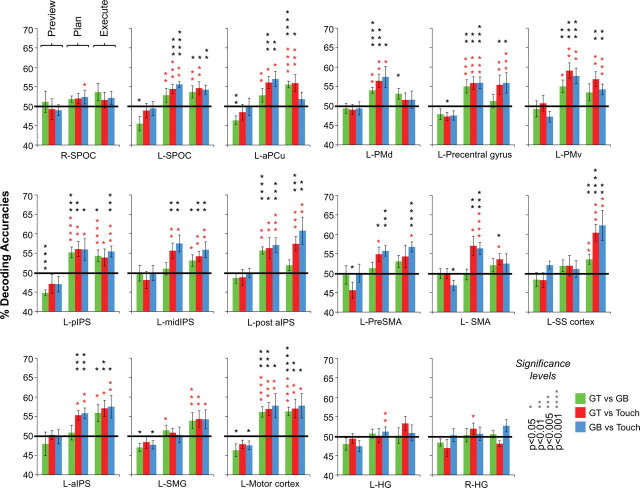
Figure 4.
Classifier decoding accuracies for each ROI for the three trial phases (preview, plan, and execute; the middle 3 bars correspond to accuracies elicited during the plan phase). Error bars represent SEM across subjects. Solid black lines are chance accuracy level (50%). Black asterisks assess statistical significance with two-tailed t tests across subjects with respect to 50%. Note that no above-chance decoding is shown during the preview phase, when subjects were unaware which movement they were going to perform. Red asterisks denote statistical significance with paired two-tailed t tests for decoding accuracies across subjects for plan and execute phases with respect to within-trial decoding accuracies found during the preceding preview phase (i.e., assessing where accuracies are higher than that for simple object visual presentation, when subjects were unaware which action they would be performing). Importantly, any areas showing significant decoding during the plan phase with respect to 50% also show significant decoding with respect to the permutation tests (see Materials and Methods) and preview phase. Note that accurate classification can only be attributed to the spatial response patterns of different planned movement types and not the overall signal amplitudes within each ROI (see Fig. 5). Also note that decoding accuracies are color coded according to pairwise discriminations and not trial types.

