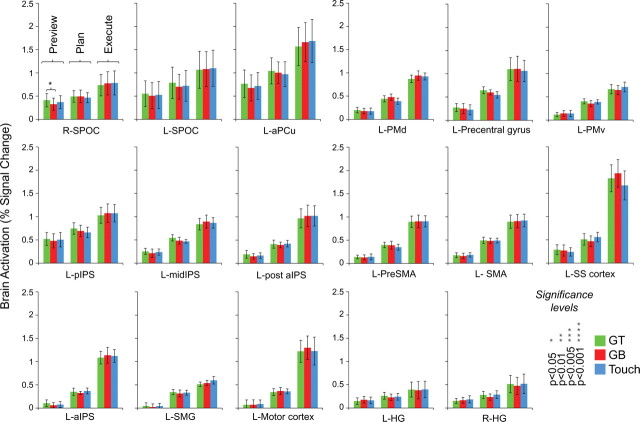
Figure 5.
No fMRI signal amplitude differences found within the parieto-frontal regions used for pattern classification. Responses are averaged across voxels within each ROI and across subjects (2-volume averaged windows corresponding to preview, plan, and execute phases). Note that only one significant univariate difference is observed in R-SPOC, a non-decoding region. Error bars represent SEM across subjects.

