
Figure 2.
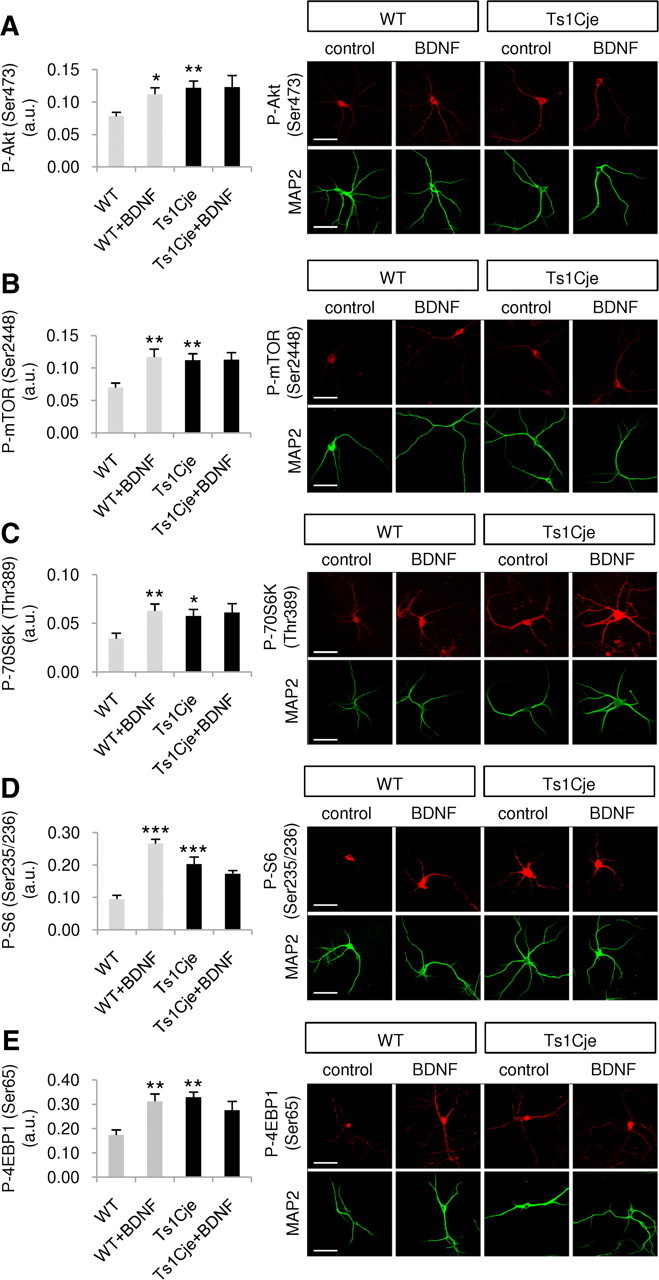
BDNF signaling through the Akt–mTOR cascade is impaired in dendrites of Ts1Cje hippocampal neurons. The fluorescence intensity of the indicated immunolabeled proteins was quantified in the dendrites of WT and Ts1Cje hippocampal neurons, in the presence or absence of BDNF (100 ng/ml for 10 min). A, Significant increases were observed in phospho-Akt (Ser473) in BDNF-treated versus untreated wild-type cells (*p = 0.019, t test), and in nontreated Ts1Cje versus wild-type cells (**p = 0.005, t test); n = 6. B, Significant increases in phospho-mTOR (Ser2448) were observed in BDNF-treated versus untreated wild-type cells (**p = 0.010, t test) and in untreated Ts1Cje versus wild-type cells (**p = 0.010, t test); n = 5–6. C, Significant increases in phospho-p70S6K (Thr389) were observed in BDNF-treated versus untreated wild-type cells (**p = 0.008, t test) and in untreated Ts1Cje versus wild-type cells (*p = 0.023, t test); n = 7–8. D, Significant increases in phospho-S6 (Ser235/236) were observed in BDNF-treated versus untreated wild-type cells (***p < 0.001, t test) and in untreated Ts1Cje versus wild-type cells (***p < 0.001, t test); n = 7–9. E, Significant increases in phospho-4EBP1 (Ser65) were observed in BDNF-treated versus untreated wild-type cells (**p = 0.004, t test) and in untreated Ts1Cje versus wild-type cells (**p = 0.002, Mann–Whitney test); n = 6. Data are expressed as the mean ± SEM. Representative immunocytochemistry images are shown in each case, and MAP2 was used as a dendritic marker. Scale bars, 60 μm.