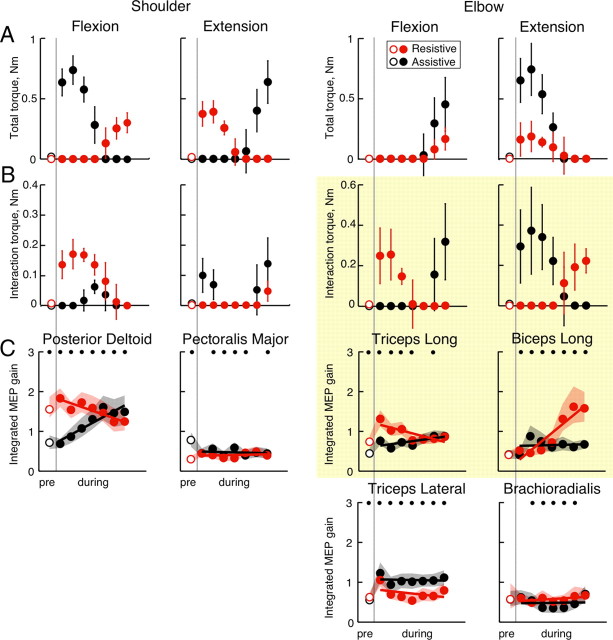
Figure 8.
Comparison of movement dynamics and MEP gain. The plots show joint torques in different directions (A, B) and MEP gains (C) before (pre) and during movement (separated by the gray line). The main result is highlighted by the yellow box. A, Columns show the total torque toward shoulder flexion, shoulder extension, elbow flexion, and elbow extension, during resistive (red) and assistive (black) conditions. B, Interaction torques in the same conditions. C, MEP gains calculated based on the integrated MEP method shown in Figure 1D. The symbols show mean gain values, the lines show regression lines, and the shaded areas show 95% confidence intervals. The black dots demarcate significant differences (bootstrap procedure) (see Materials and Methods) between assistive and resistive conditions with power >0.8.

