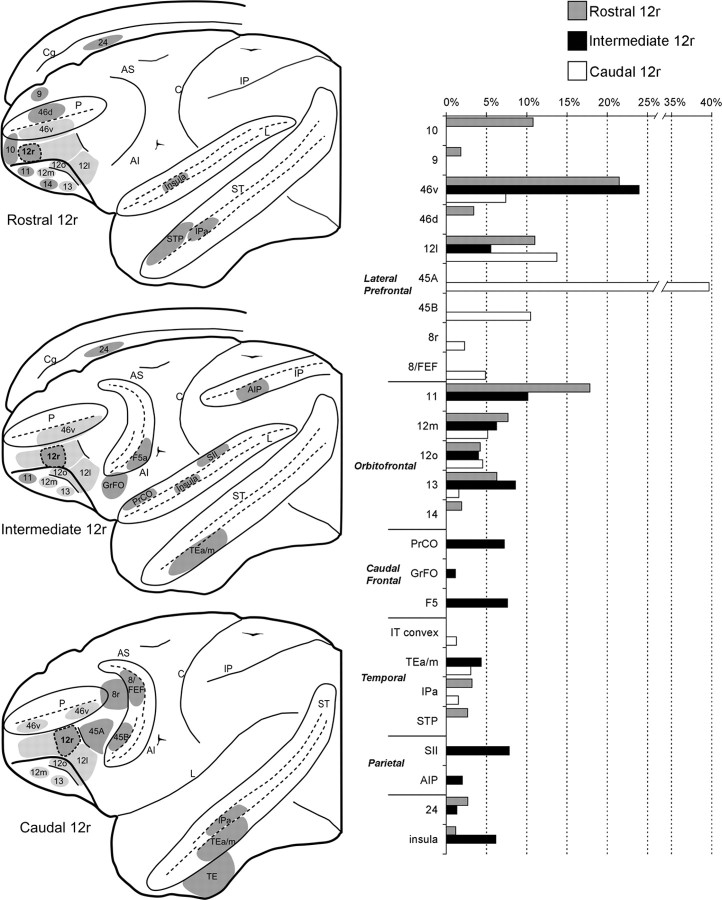
Figure 10.
Summary view of the major ipsilateral cortical connections of the rostral, the intermediate, and the caudal area 12r sector and mean percentage distribution of the retrograde labeling. In the brain drawings, areas connected with one or two area 12r sectors are shown in darker gray, and those connected to the entire area 12r are shown in lighter gray. In the bar graph, only connections with mean value >1% are shown. Data presented for caudal area 12r are from Gerbella et al. (2010). Abbreviations as in Figures 1 and 3.

