Figure 3.
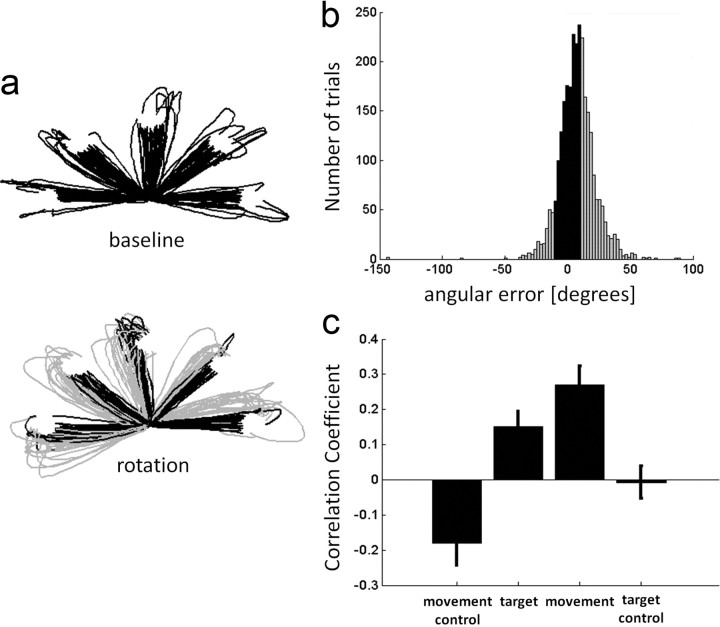
Accurate and inaccurate movement trajectories. a, Example of cursor trajectories for the “baseline” (top) and “rotation” (bottom) conditions from one participant in all five directions. Gray trajectories denote trials that were labeled “inaccurate movements” (according to their angular error at peak velocity). Failed trials were excluded. b, Histogram of the angular errors made during rotation trials (collapsed across all directions and across all participants). Gray columns denote the angular errors of “inaccurate” trials. c, Mean CCs, computed for accurate trials only, across participants and across directions for the different conditions. Movement CCs are significantly larger than movement control values (p < 0.005). “Target aligned” CCs are still significantly higher than the “target control” values (p < 0.005). Error bars denote SEM across participants.

