
Figure 7.
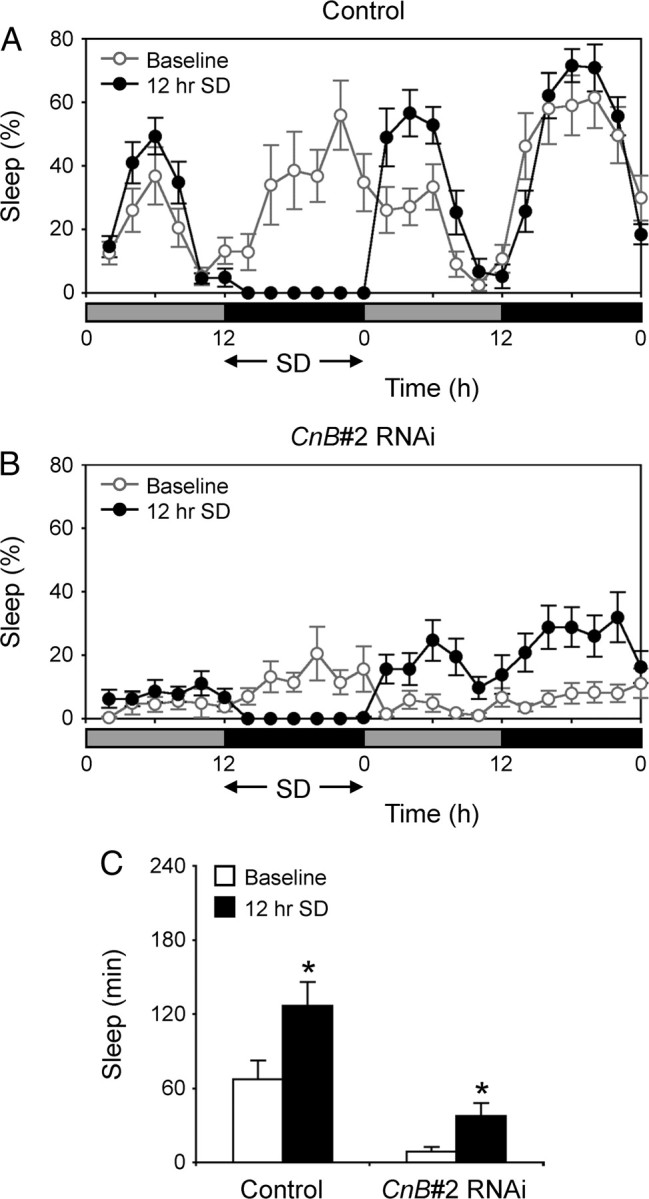
Homeostatic response to sleep deprivation in CnB#2 RNAi flies. A, B, Sleep profiles plotted in 2 h bins over 2 d under DD conditions for control flies (elav-Gal4;UAS-Dicer-2 × w1118) (A) or CnB#2 RNAi (elav-Gal4;UAS-Dicer-2 × CnB#2) male flies (B). The conditions are same as Figure 6 (n = 11–12). C, The amount of sleep during the first 4 h of baseline (open bars) and recovery (solid bars). Significant sleep rebound was observed in both strains (Student's t test; *p < 0.01). Data are presented as mean ± SEM.