
Figure 5.
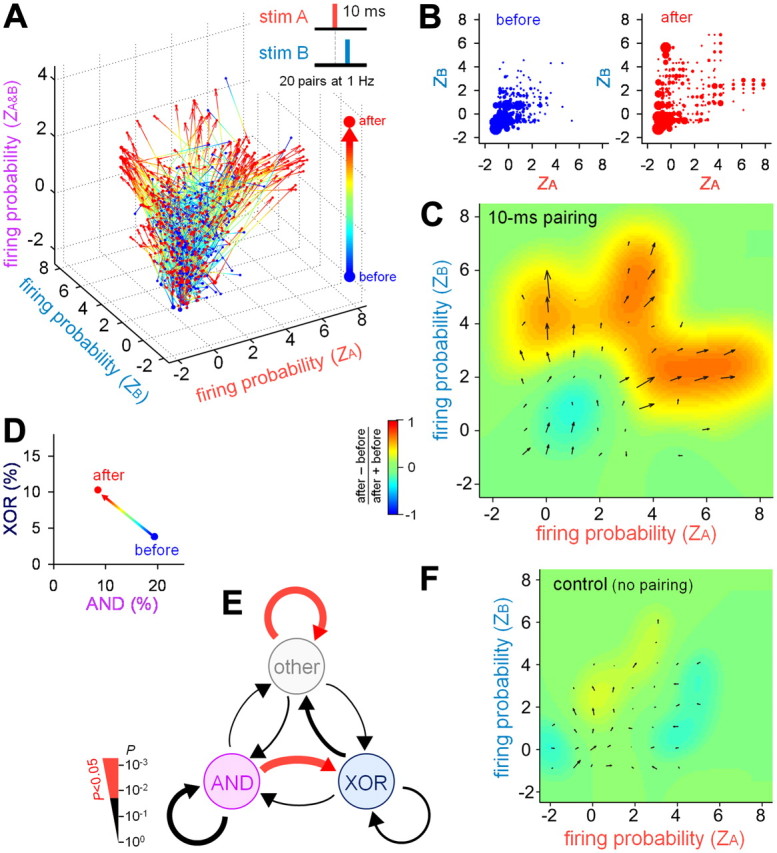
Repetitive paired stimulation-induced remodeling of the logical operation (10 ms interval). A, Standardized firing probability (Z score) of 680 PCs from 11 slices in response to stim A, stim B, and stim A&B before and after 20 10-ms-interval pairs of stim A and stim B at 1 Hz. B, A two-dimensional Z-score plot of stim A versus stim B before (left) and after (right) repetitive paired stimulation. C, Illustration of the changes in the CA1 firing properties. Each vector indicates the average Z-score movement (direction and distance), which is calculated as the sum of all outgoing vectors from a given area and all incoming vectors to the area. The background pseudocolor image indicates a relative change in the number of neurons, which is defined as (Nafter − Nbefore)/(Nafter + Nbefore), where N is the number of neurons in an area. D, Pairing-induced changes in the ratios of AND/XOR neurons. E, Pairing-induced switching in the AND/XOR properties. The thickness of the vectors indicates P values that were assessed by the χ2 test in which the trend to convert one operator to another was compared with the value that was expected under the null hypothesis of independence between the prior and posterior distributions. F, No significant changes in the CA1 firing properties occurred in the absence of repetitive paired stimulation. The illustration details are the same as in C. N = 1604 neurons from 15 slices.