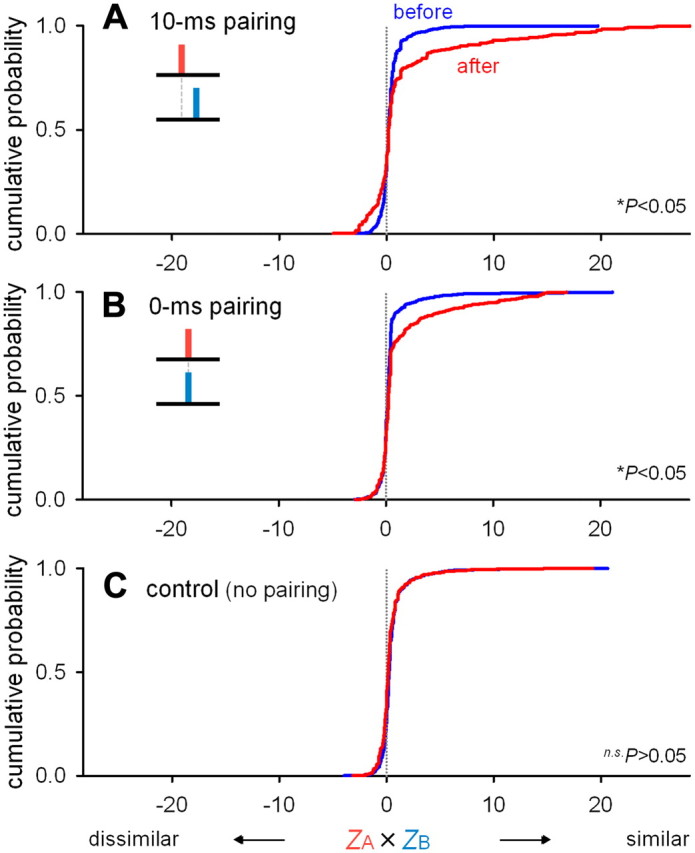
Figure 7.

Plasticity-induced spike integration and segregation. A–C, Cumulative distributions of the similarity index in responses to stim A and stim B before and 30 min after repetitive paired stimulation at intervals of 10 ms (A) and 0 ms (B) and no paired stimulation (C). The similarity index in the abscissa is defined as the product of the standardized firing probability in stim A and stim B (ZA × ZB). A, *p < 0.05, before versus after, Kolmogorov–Smirnov test; N = 680 neurons from 11 slices. B, *p < 0.05, N = 679 neurons from 11 slices. C, n.s.p > 0.05, N = 1604 neurons from 15 slices.
