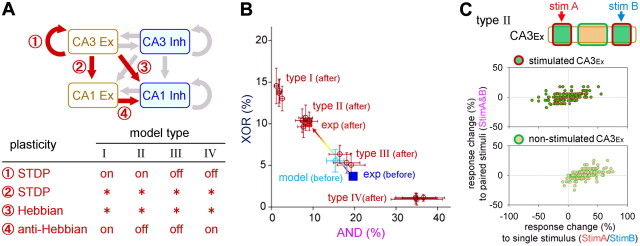
Figure 9.
Plasticity rule-dependent AND/XOR reorganization: numerical simulation. A, Schematic illustration of the synaptic plasticity rule that was incorporated into our hippocampal network model. CA3Ex-to-CA3Ex and CA3Ex-to-CA1Ex synapses were equipped with STDP, whereas excitatory CA3Ex-to-CA1Inh and CA1Ex-to-CA1Inh synapses were equipped with Hebbian and anti-Hebbian synaptic plasticity rules, respectively. Four types (I–IV) of the network models were generated based on all of the possible combinations of the synaptic plasticity rules, which are shown in the bottom table, in which “on” and “off” indicate the implementation of the corresponding rule and the wildcard (*) allows either on or off. B, Repetitive paired stimulation-induced changes in the fractions of AND/XOR neurons in the four model types. Each type, except for type III, contains four datasets (mean ± SD), which correspond to four (= 22) possible on/off combinations of two rules that were applied to the CA3Ex-to-CA1Ex and CA3Ex-to-CA1Inh synapses. Three datasets are shown in the type III model, in which at least one of the CA3Ex-to-CA1Ex and CA3Ex-to-CA1Inh synapses are turned on (22 − 1 = 3). The error bars represent the SD of 10 trials with different random seeds. The closed squares represent experimental data before (blue) and after (red) the presentation of repeated stimuli. C, The normalized response change, which is defined as (Pafter − Pbefore)/(Pafter + Pbefore), was calculated for stim A or stim B (abscissa) and stim A&B (ordinary), where P is the firing probability of CA3Ex neurons before and after repetitive paired stimulation. Each dot indicates a single CA3Ex neuron.

