
Figure 7.
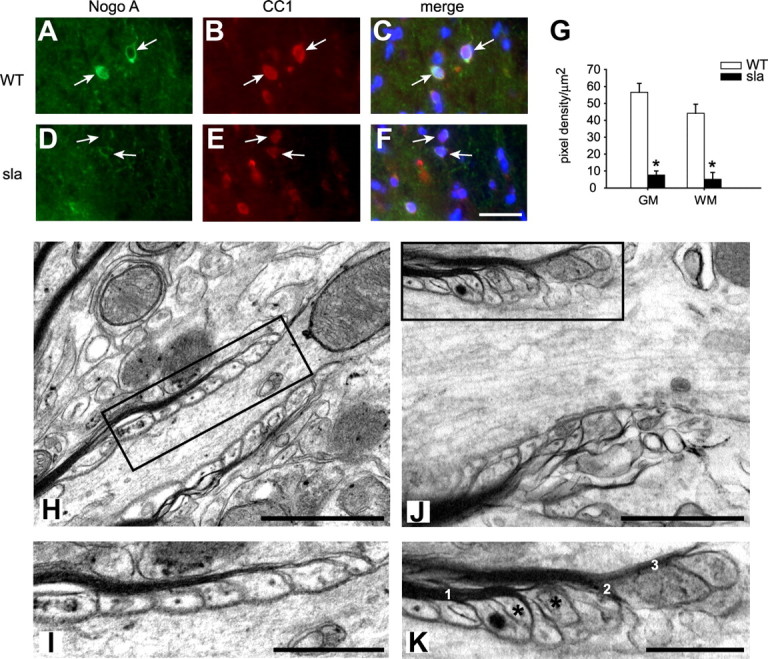
Reduced expression of Nogo A in oligodendrocytes in the sla spinal cord and ultrastructural abnormalities at the paranodal region in sla mice. A–C, Wild-type spinal cord shows strong immunofluorescence labeling for Nogo A (A, arrows) in CC1-labeled oligodendrocytes (B, arrows). D–F, In contrast, sla spinal cord shows markedly reduced labeling for Nogo A (D, arrows) in CC1-labeled oligodendrocytes (E). C and F show merged images. G, Quantification of the Nogo A pixel density per square micrometer of individual CC1-positive cells (30 per animal, n = 3 mice) in the gray and white matter of the lumbar spinal cord shows a significant reduction of Nogo A expression in sla mice compared with wild-type mice. Results are shown as mean ± SEM. *p ≤ 0.05, Student's t test. Scale bar: F, 30 μm. H, Electron micrograph of a paranodal region in the gray matter of a wild-type mouse. I, The area of the paranode outlined in the rectangle in H is shown at higher magnification. Note the regularly arranged terminal myelin loops that are closely associated with the axonal membrane of the paranodal region. J, In contrast, the paranodal region in the sla spinal cord gray matter shows abnormal structure. K, A higher magnification of the area outlined in the rectangle in J. Note the multiple loops of myelin (labeled 1, 2, and 3), and the floating paranodal loops that fail to make contact with the axonal membrane (asterisks). Scale bars: H, J, 1 μm; I, K, 0.5 μm.