
Figure 6.
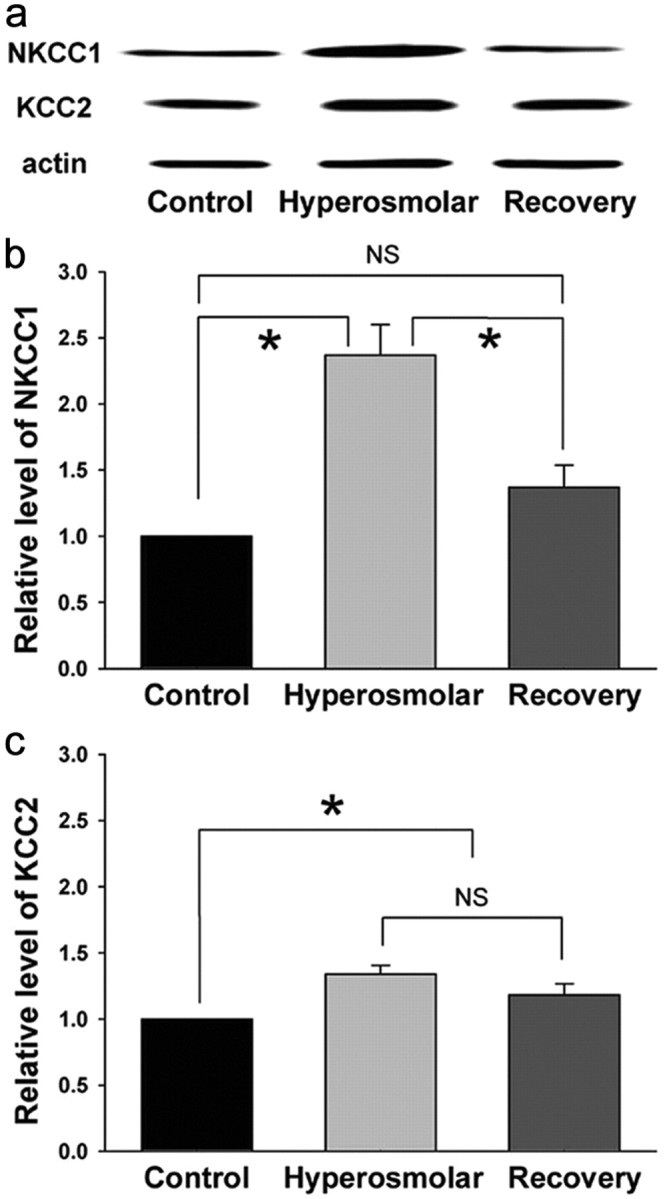
Chronic hyperosmotic stress increases the NKCC1 protein level in the SON. a, NKCC1, KCC2, and actin bands recognized by Western blot for the SON tissue samples obtained from rats under different experimental conditions. b, c, Summary graphs showing the relative levels of NKCC1 (n = 8) and KCC2 (n = 12) in the SONs of rats under different experimental conditions. For each experiment, the values were normalized to the samples collected from the control rats. NKCC1 and KCC2 levels were normalized to actin to control for loading. *p < 0.05; NS, statistically not different (pairwise comparison with Tukey's test or Dunn's method after Kruskal–Wallis one-way ANOVA on ranks). Recovery, Rats supplied with tap water as drinking water for 7 d after 2% NaCl drink for 1 week.