Figure 6.

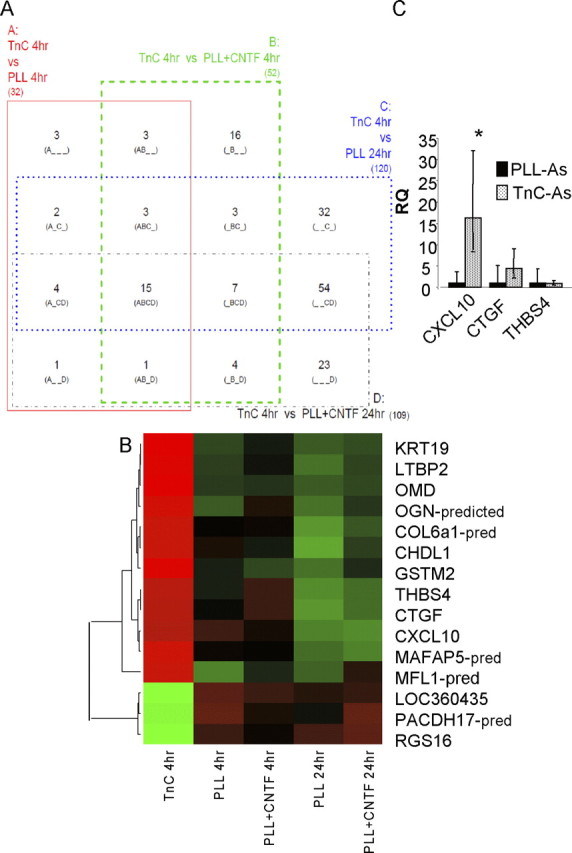
Candidate genes identified by microarray are verified via qRT-PCR. A, A four-way Venn diagram in which each rectangle (A, B, C, and D) represents a pairwise comparison between TnC-astrocytes after 4 h (TnC 4 h) and one of the other four conditions: PLL-astrocytes after 4 h (PLL 4 h) and 24 h (PLL 24 h), PLL-astrocytes treated with CNTF after 4 h (PLL+CNTF 4 h) and 24 h (PLL+CNTF 24 h). Each of the 15 segments indicates one particular intersection, e.g., “A_C_” contains the number of probes (genes) significantly different for the A (TnC 4 h vs PLL 4 h) and C (TnC 4 h vs PLL 24 h) comparisons but not the B (TnC 4 h vs PLL+CNTF 4 h) and D (TnC 4 h vs PLL+CNTF 24 h) comparisons. Numbers shown indicate the number of significant genes (FDR < 0.05, n = 3) for each combination. B, Heatmap with dendrogram of the 15 probes significantly different in all four comparisons involving TnC-astrocytes after 4 h (“ABCD” in Venn diagram). Green is low expression, red is high, black is intermediate; expression is standardized within each gene, and within-group median expression is shown. Dendrogram uses complete linkage and Euclidean distance. C, qRT-PCR, relative quantification (RQ) results for CXLCL10, CTGF, and THBS4. CXCL10 mRNA was significantly increased in TnC-astrocytes when compared with astrocytes treated with CNTF (Fig. 7B) (*p < 0.05, n = 3).
