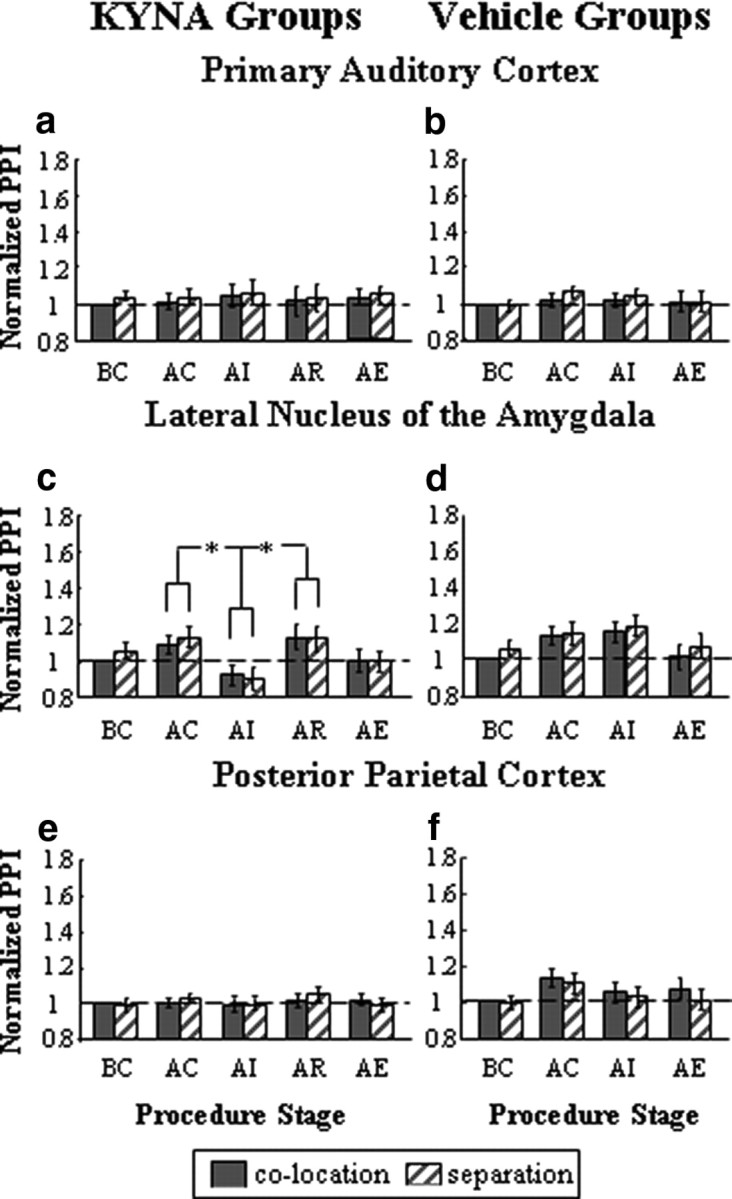
Figure 3.

Normalized PPI elicited by the conditioning-control prepulse at different procedure stages in A1/KYNA group (n = 12) (a), A1/vehicle group (n = 12) (b), LA/KYNA group (n = 12) (c), LA/vehicle group (n = 12) (d), PPC/KYNA group (n = 12) (e), and PPC/vehicle group (n = 12) (f). See Figure 2 legend for the explanation of symbols and abbreviations. *p < 0.05 (by repeated-measures ANOVA and Bonferroni's pairwise comparisons).
