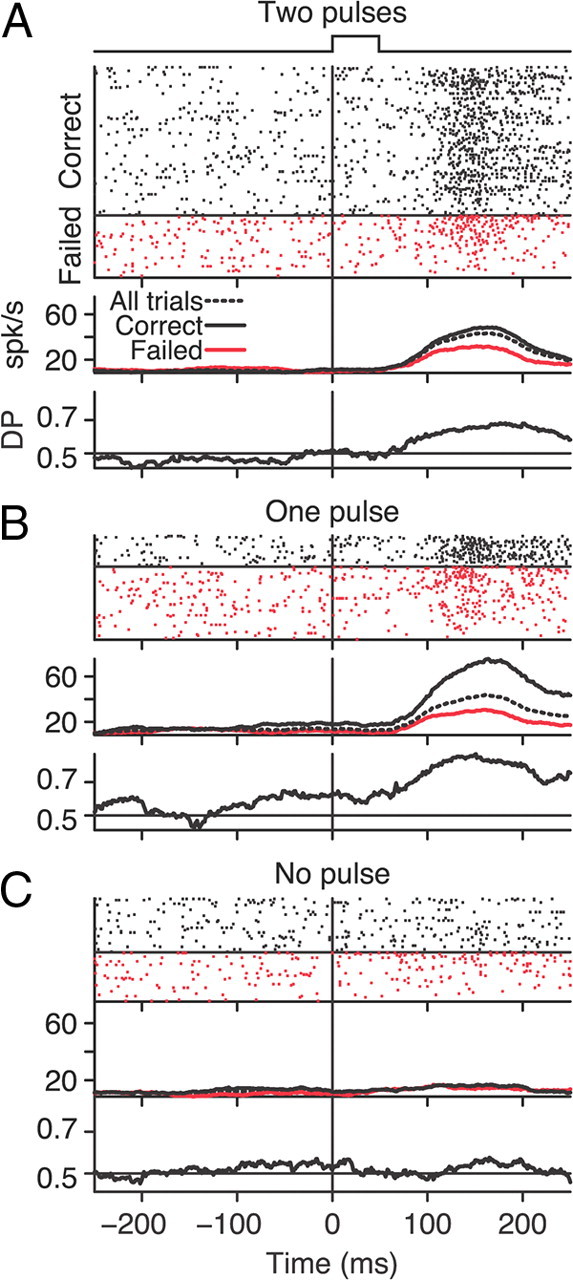
Figure 2.

Example MT neural response and neural–behavioral covariation for each stimulus condition. Neural responses on trials with two motion pulses occurring simultaneously in both RFs (A), one motion pulse occurring in the RF of the neuron (B), and one motion pulse occurring in the RF of the other neuron (C). Each panel has three graphs. The topmost graph shows spike rasters in which each row corresponds to a single trial. Trials were sorted by reaction time and trial outcome (correct trials: black ticks, above horizontal line; failed trials: red ticks, below horizontal line). The middle graph shows the average firing rate as a function of time for correct (black), failed (red), and all (dashed) trials. The bottom graph shows DP (see Materials and Methods) as a function of time. Average firing rates and DP were computed using a 100 ms sliding window.
