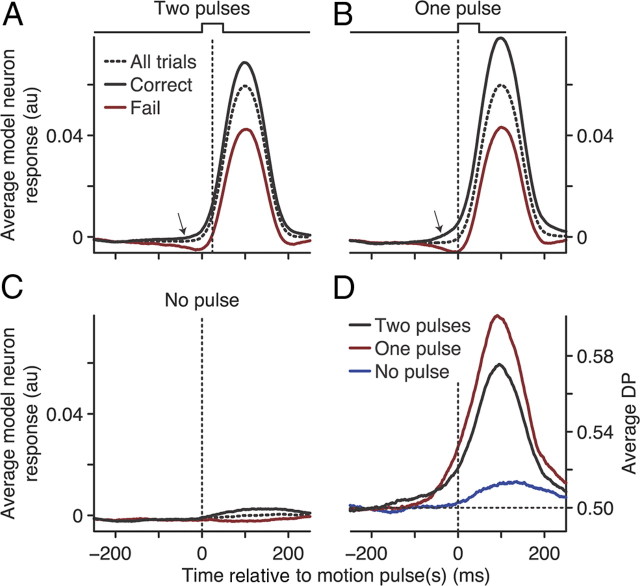
Figure 5.
The neural–behavior covariations of the computational model mimicked MT neural recordings. A–C, Response of a single model neuron (arbitrary units) for each stimulus condition averaged over 250,000 trials. The average responses were computed and arranged the same way as the MT responses shown in Figure 3A–C. Arrows indicate comparison time point for early divergence between correct and failed responses. D, The DP of a single model neuron as a function of time. DP was computed and arranged the same way as the MT DP shown in Figure 3D.

