
Figure 6.
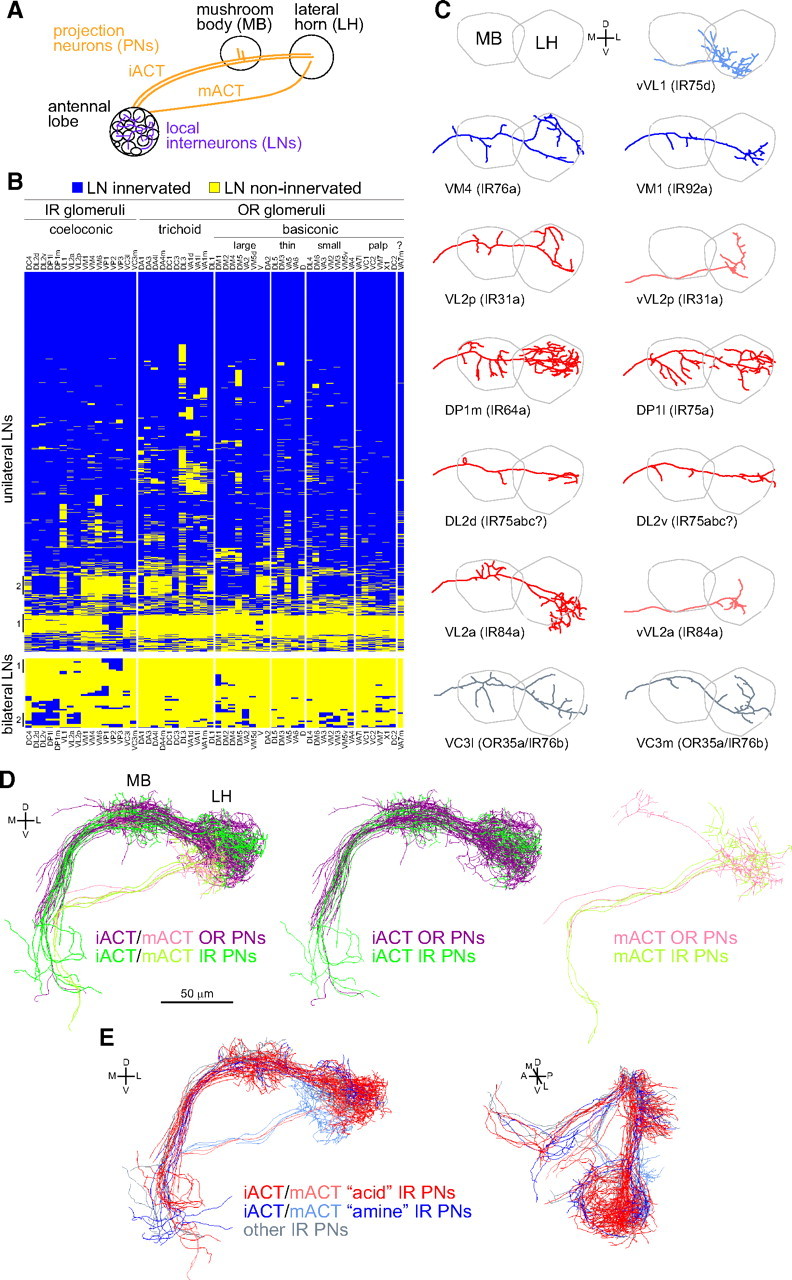
Neuroanatomy of processing and higher-order representations of IR-dependent odor stimuli. A, A schematic of higher olfactory brain center anatomy. PNs take one of two tracts to the higher centers, the inner antennocerebral tract (iACT) or mACT, depending on whether they derive from the anterodorsal/lateral neuroblasts or ventral neuroblast, respectively. B, Glomerular innervation patterns of 1489 singly labeled unilateral LNs (top) or 43 singly labeled bilateral LNs (bottom) organized by hierarchical clustering, using data from Chou et al. (2010b). Each row represents the innervation pattern of a single LN (blue, innervated; yellow, non-innervated). The columns represent 54 glomeruli, arranged by sensillar class to broadly demarcate the IR and OR olfactory subsystems. VA7m (marked with a “?”) is innervated by a molecularly undefined population of OSNs. Vertical lines to the left of the table mark subsets of LNs with notable glomerular innervations (see Results). Cluster analysis, using complete linkage and Euclidean distances, was performed using R software (www.r-project.org). C, Plots of single representative traced neurons, after registration, for 13 available PN classes innervating IR glomeruli. PN classes are ordered by putative functional classes (defined by corresponding IR OSN inputs) and then by IR gene name. VL2a and VL2p are innervated by PNs derived from both lateral and ventral neuroblasts that follow the iACT and mACT tracts, respectively; the “v” suffix denotes the latter type. PNs are colored according to the classes described in E. Raw image data for different PN classes are from the following sources: VL2a (Wong et al., 2002); vVL1, VL2p, VM1 (Jefferis et al., 2007); DL2d, DL2v, DP1l, VC3l, VC3m, vVL2a, vVL2p, VM1, VM4 (Chiang et al., 2011). D, 3D renderings of tracings for all registered OR (purple/pink) and IR (dark/light green) PN classes. Separate renderings for iACT and mACT PNs (in paler colors) are shown to the right. Data for OR PNs is adapted from Jefferis et al. (2007). E, 3D renderings of tracings for all registered IR PNs innervating IR8a-dependent/acid-responsive glomeruli (red: IR31a/VL2p, IR64a/DP1m, IR75a/DP1l, IR75abc/DL2, IR84a/VL2a), IR25a-dependent/amine-responsive glomeruli (blue: IR76b/VM4, IR75d/VL1, IR92a/VM1), and PNs innervating other IR-positive glomeruli (gray: IR76b/OR35a/VC3). Paler red and blue colors are used for mACT neurons. D, Dorsal; L, lateral; M, medial; V, ventral.