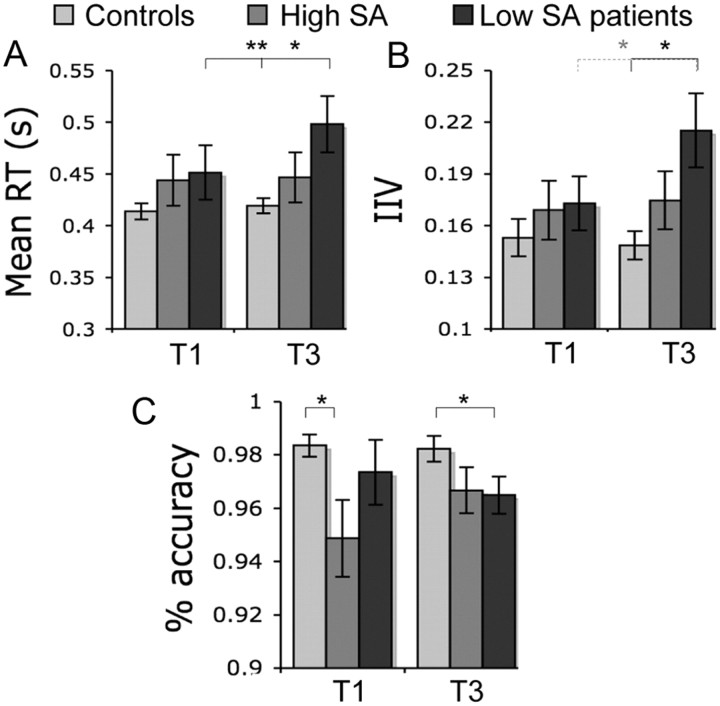
Figure 3.
Behavioral results for the first (T1) and the last (T3) third of the choice reaction task. Controls (light gray), high-SA TBI patients (middle gray), and low-SA patients (dark gray) are shown. A, Mean reaction time in seconds. B, IIV ± SEM. C, Percentage accuracy ± SEM. **p < 0.001; *p < 0.05; Statistical significance. Light gray asterisk refers to p < 0.1 difference between low-SA patients at T1 and T3.

