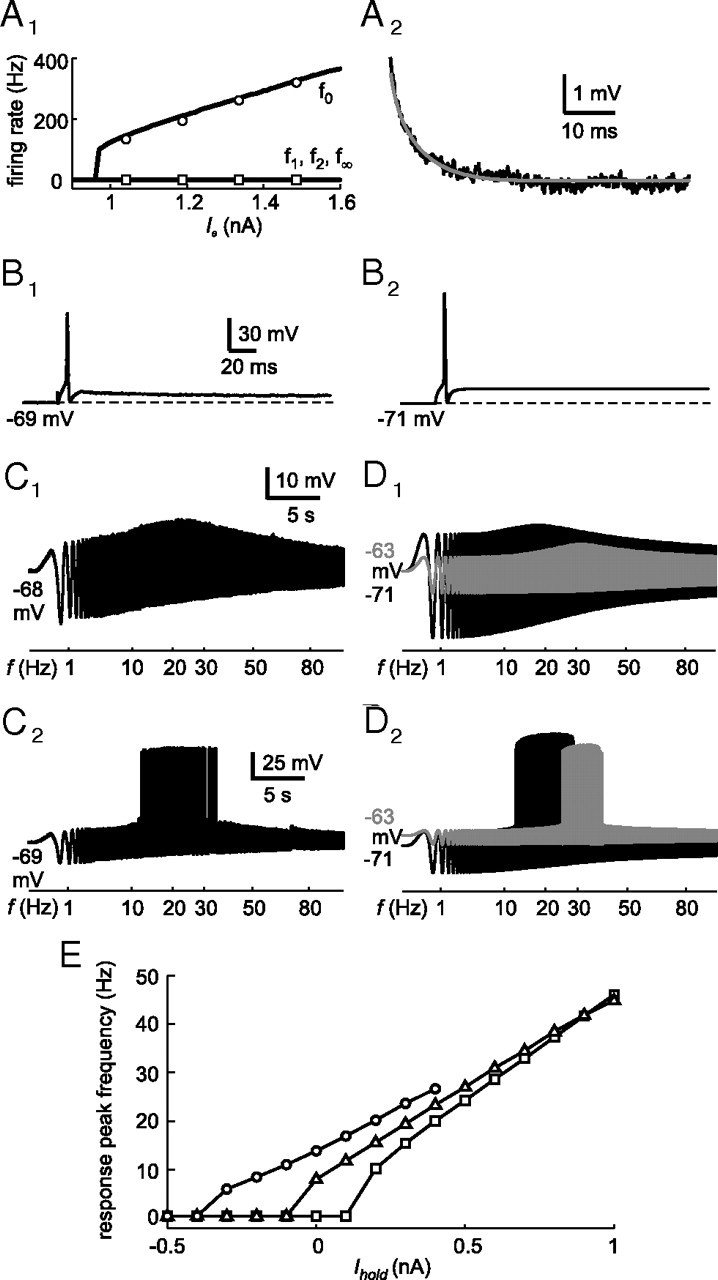
Figure 5.

Comparison between phasic 2°VN data and model. A1, Fit (black lines) to the frequency–current (f–I) response of a phasic model neuron (P8) (f0, circles; f1, diamonds; f2, triangles; f∞, squares). A2, Fit (gray line) to the membrane potential decay (black line) after injection of a current step of 0.26 nA. B, Comparison between the evoked discharge of the phasic 2°VN (B1) and the resulting phasic model neuron (B2) during depolarization by a 1 nA current pulse. C, D, Subthreshold response (C1, D1) and spike discharge (C2, D2), evoked by sinusoidally modulated current injection (ZAP stimuli), of the same phasic 2°VN (C1, I0 = 0.9 nA, Ihold = 0; C2, I0 = 1 nA, Ihold = 0) and the corresponding model [D1, I0 = 0.9 nA, Ihold = 0 (black trace) and I0 = 0.5 nA, Ihold = 0.6 nA (gray trace); D2, I0 = 1 nA, Ihold = 0 (black trace) and I0 = 0.52 nA, Ihold = 0.6 nA (gray trace)]. E, Response peak frequency during ZAP stimuli at different holding currents (Ihold) and stimulus amplitudes [I0 = 0.6 nA (circles), I0 = 0.3 nA (triangles), I0 = 0.1 nA (squares)]. The calibration bars in B1, C1, and C2, apply to B2, D1, and D2, respectively.
