Figure 7.

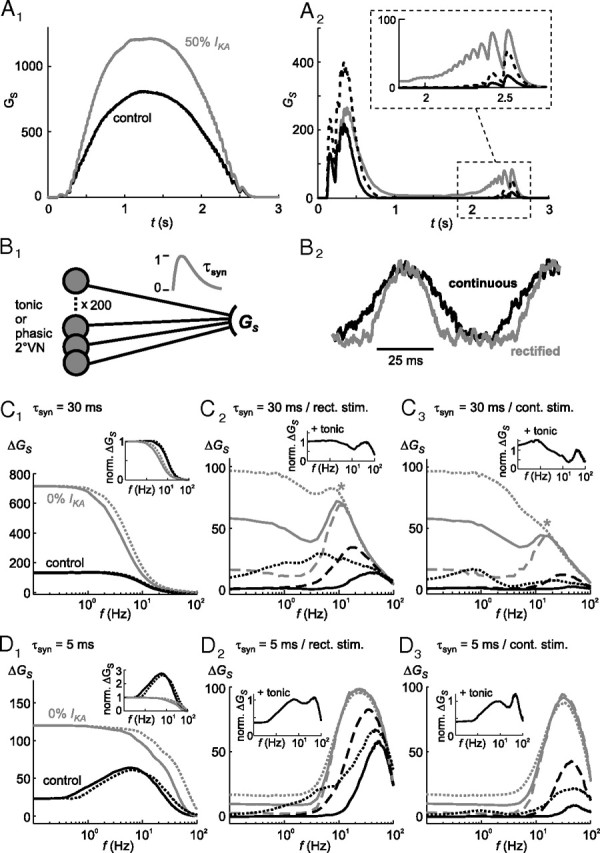
Role of ion channels, synaptic inhibition, noise currents, and postsynaptic time constants in shaping the dynamics of population model responses. A, Specific implication of altered parameters on the calculated postsynaptic conductance GS of tonic (A1) and phasic (A2) model neuron populations during sinusoidally modulated pulse train stimulation; overlay of control responses (A1, A2, black lines), with reduced (50%) adaptation current IKA in tonic population responses (A1, gray line), with reduced (50%) low-threshold potassium currents (ID) (A2, black dotted line) and with reduced (50%) synaptic inhibition through local interneurons (A2, gray line) in phasic model populations; inset in A2 shows the response to the last pulse train stimuli at an extended time and amplitude scale; postsynaptic time constant τsyn = 30 ms. B, Scheme depicting the estimation of the postsynaptic conductance GS (B1) and an example of noisy stimulation currents (f = 15 Hz) that mimic the activation with (continuous) or without afferent resting activity (rectified) (B2). C, D, Calculated postsynaptic conductance amplitudes ΔGS of tonic (C1, D1) and phasic vestibular population model responses (C2, C3, D2, D3) with large (τsyn = 30 ms) (C) or small (τsyn = 5 ms) (D) postsynaptic time constants; overlay of control responses (C1–C3, D1–D3, black lines), without adaptation current IKA (gKA = 0; gray lines) in tonic (C1, D1) population responses, with reduced (50%) low-threshold potassium currents (ID; black dotted lines), with reduced synaptic inhibition (50%, black dashed lines), without synaptic inhibition (gray lines) and with normal (100%, gray solid lines), increased (200%, gray dotted lines) or without (0%, gray dashed lines) noise currents [ε(t)]; the insets in C1 and D1 represent responses that were normalized to control values at 0.1 Hz. The insets in C2, C3, D2, and D3 show the normalized combined output of 100 tonic and 100 phasic 2°VN model neurons onto a putative target neuron with short (C2, C3) or long τsyn (D2, D3). Results from simulations with (continuous) and without afferent resting activity (rectified) are indicated by the dotted and solid lines, respectively, in the tonic (C1, D1) and in different plots in the phasic population (C3, D3, and C2, D2, respectively).
