
Figure 1.
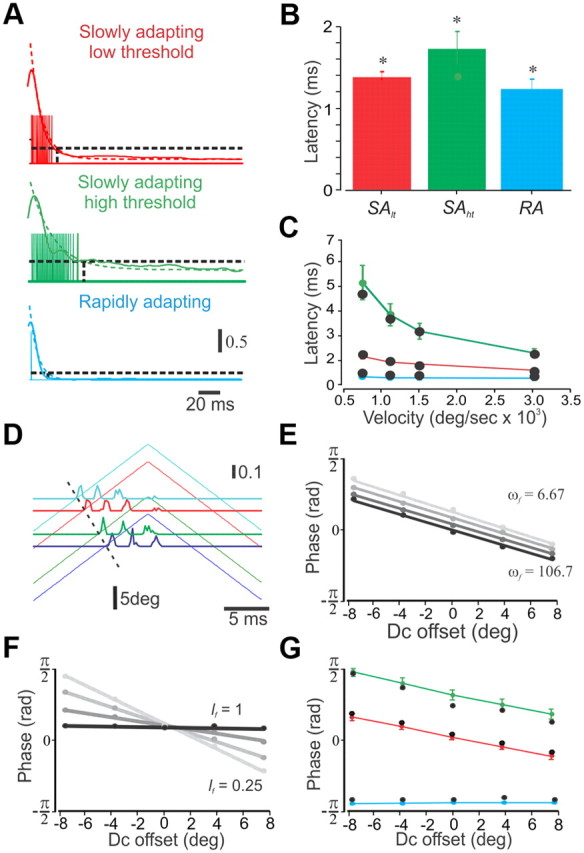
Fitting the model parameters. A, Responses of the three subtypes of model neurons (vertical lines) superimposed on the smoothed average PSTHs for the three neuronal subtypes (colored solid lines) and their corresponding exponential fits (dashed lines). We adjusted the ωr of the model neuron until 10% of the initial firing of the PSTHs was reached (dashed horizontal line). The calibration indicates spikes/bin. The inverse of the decay time constant of the exponential fit for each of the subtypes are as follows: SAlt, −93.9; SAht, −46.4; RA, −128.6. B, Response latency of the neuronal subtypes to step stimuli (SAlt, 1.39 ± 0.06 ms; SAht, 1.73 ± 0.2 ms; RA, 1.22 ± 0.08 ms; *p < 0.01). C, Dependency of latency to first spike on whisker deflection velocity in the three neuronal types. The colored lines and circles indicate the neuronal data, whereas the solid black circles indicate the fit of the model. D, Dependency of firing phase on DC offset in an example SAlt neuron. The horizontal lines show the PSTHs, whereas the diagonal lines show the corresponding stimuli. E, The impact of ωf on the interaction between DC offset and response phase. F, The impact of lf on the interaction between DC offset and response phase. G, The impact of DC offset on response phase in the three neuronal subtypes. The colored lines and circles indicate the neuronal data, whereas the solid black circles indicate the fit of the model.