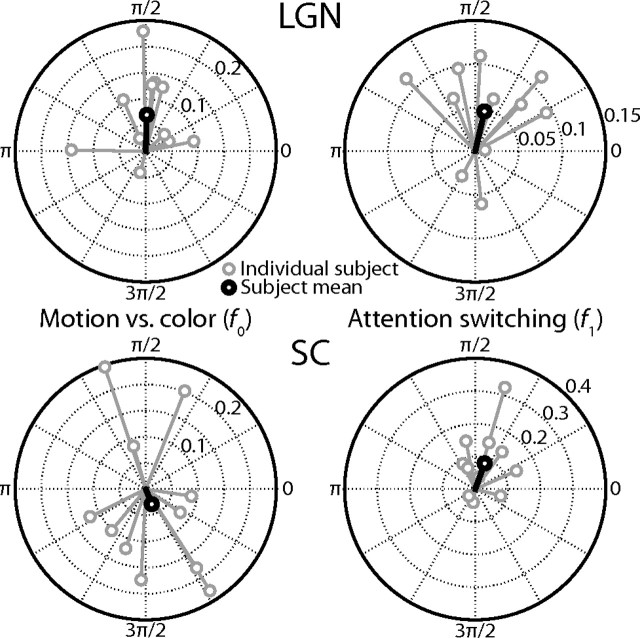
Figure 10.
Experiment 2 responses by subject. The gray circles plot for each subject the phases and amplitudes of the responses in experiment 2 as a vector average of the responses of all of the individual voxels in each ROI. The black circles plot the vector average over all subjects. The left two plots indicate the responses at the fundamental frequency, f0, which is the frequency of one motion vs color attention cycle. The right two plots indicate the responses at the first harmonic, f1, which is the frequency of the switches between attentional states. The upper two plots are for the LGN and the lower two the SC.

