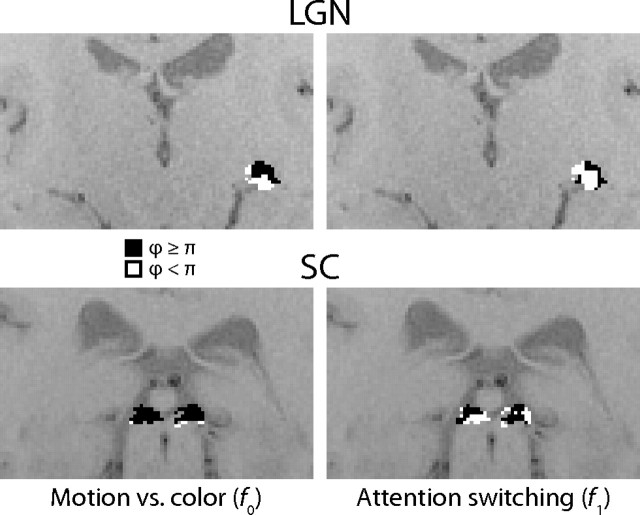
Figure 11.
Experiment 2 response phases by voxel. The voxels in each ROI are colored according to their response phases in experiment 2. Black voxels responded with a phase ϕ < π, for f0, the fundamental frequency of the motion vs color attention cycle (left two images), or f1, the frequency of attentional switches (right two images), and white voxels responded with a phase ϕ ≥ π. The two top (coronal) images show the LGN ROI in one subject (only the left LGN is visible in this plane), and the two bottom images show the SC ROI in a different subject.

