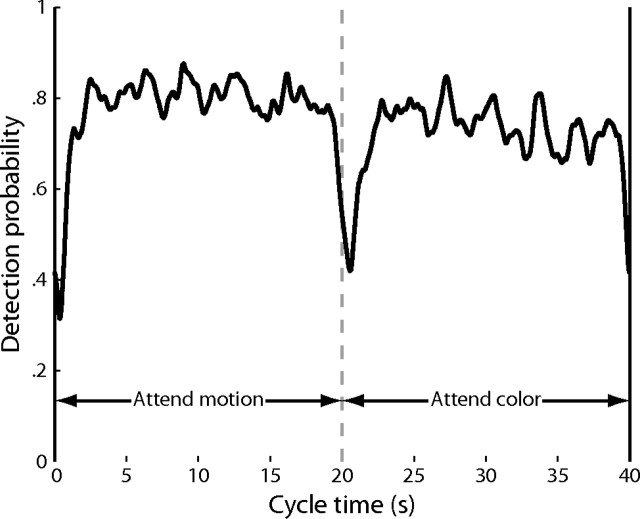
Figure 2.
Detection probability. The probability of detection of an event in experiment 2 at a given time during the stimulus cycle is plotted as a mean across subjects. During the first 20 s of each cycle, subjects attended to the moving dots and detected changes in the direction or motion coherence. During the second 20 s of each cycle, subjects attended to the colored dots and detected color convergences.

