
Figure 3.
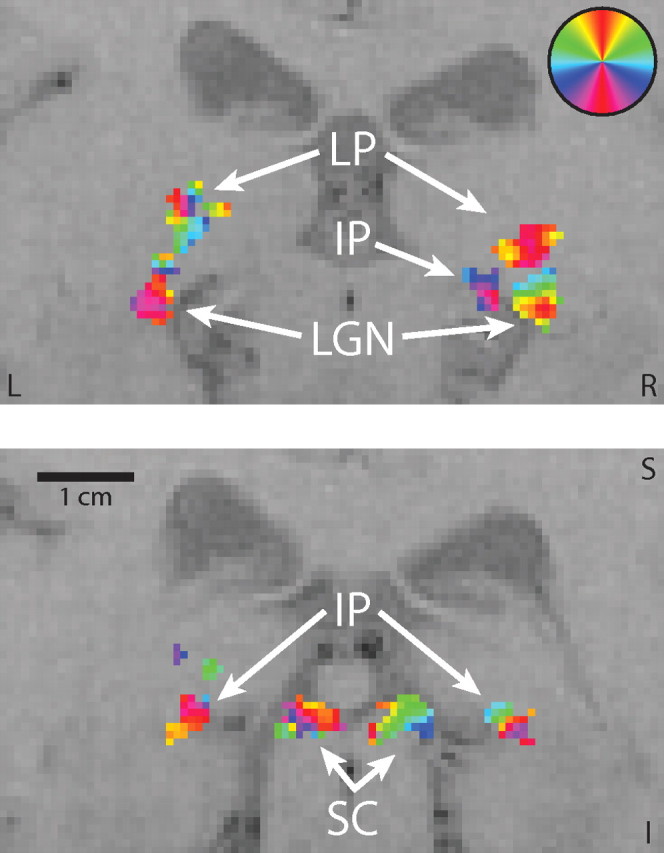
Regions of interest. Two coronal slices are shown from experiment 1 in the same well activated subject, zoomed to show the detail in the subcortex. The second slice is 4 mm posterior to the first. ROIs are shown for the LGN, LP, SC, and IP. The circular color legend in the upper right indicates the locations in the visual field to which voxels of a given color best responded. Left (L), right (R), superior (S), and inferior (I) directions are labeled.