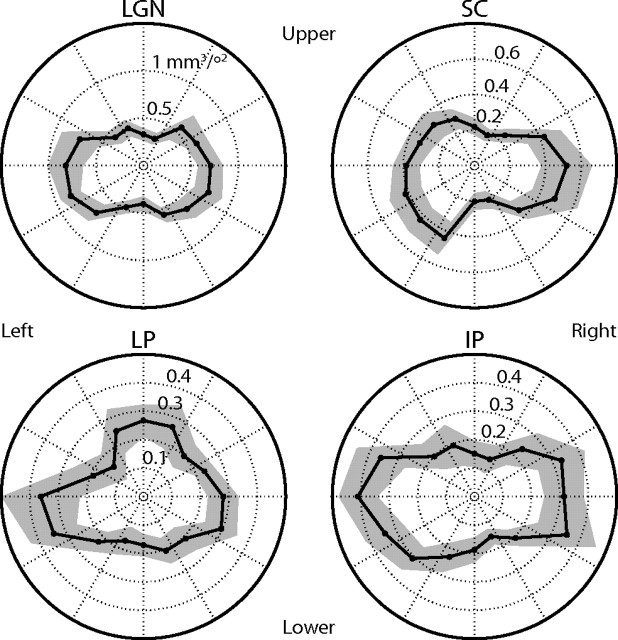
Figure 4.
Volumetric distribution of the retinotopic visual field representation. Each point in the polar plots indicates the average volume of each nucleus, across bilaterally activated subjects in experiment 1, representing a 22.5° segment of the visual field at the given polar angle. Abbreviations are as defined in Figure 3; the scales differ among the nuclei. The shaded areas indicate the extent of the SEM. The direction terms orient the plots to locations in the visual field.

