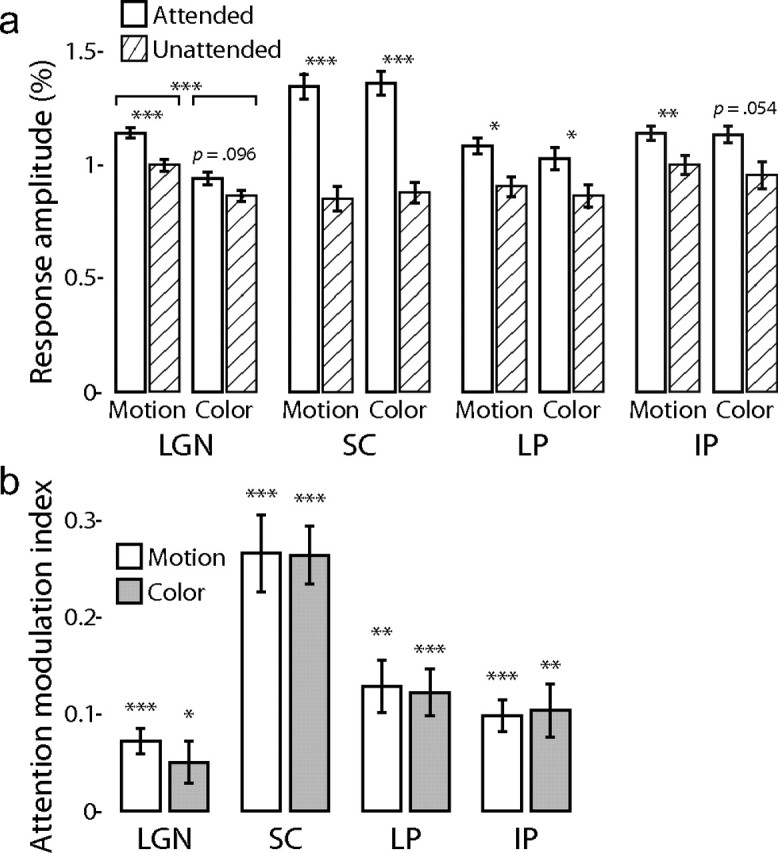
Figure 5.

Spatial attention. a, The mean response amplitudes across subjects are shown for each nucleus (abbreviations are as defined in Fig. 3) for the moving and colored dot stimuli during the attended (white bars) and unattended (hatched bars) conditions in experiment 1. Error bars indicate the SEM over the subjects. The p value is shown for the two-tailed t test between the attentional conditions for each nucleus and stimulus: *p < 0.05, **p < 0.01, ***p < 0.001. In addition, in the LGN, the mean response to the moving dot fields was significantly greater than that to the colored dot fields. b, The mean AMIs are shown for the moving dot (white bars) and colored dot (shaded bars) fields in each nucleus. The p values indicate deviance from zero. Conventions are as in a.
