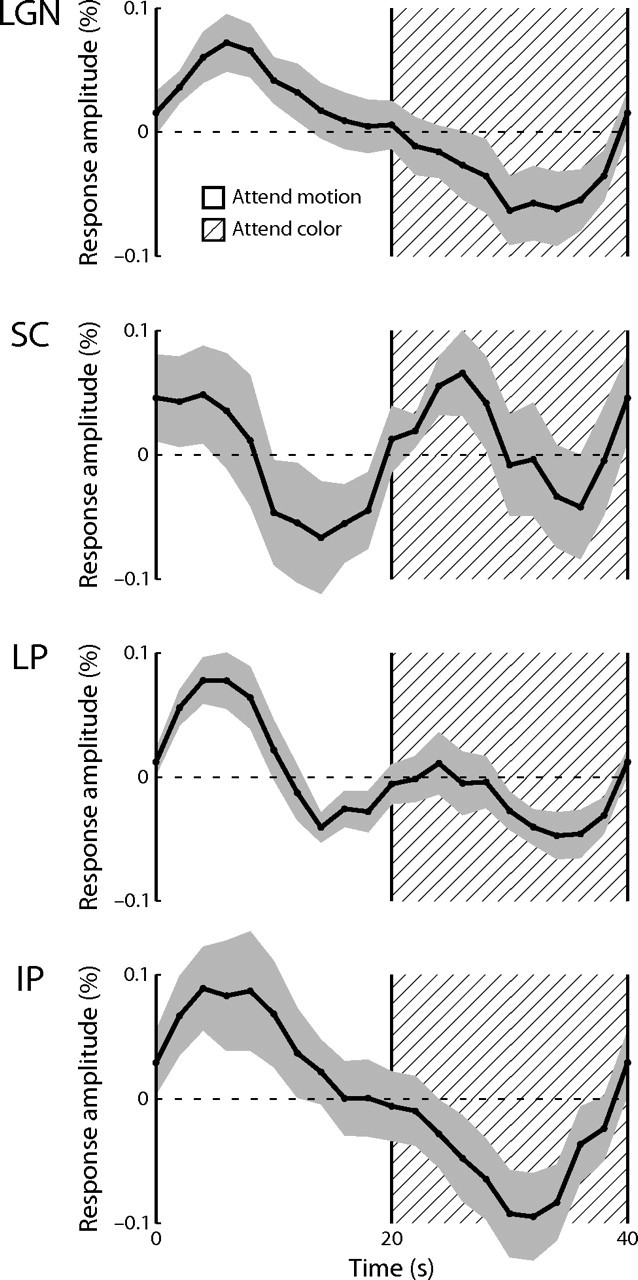
Figure 6.

Experiment 2 mean time series. The mean response over subjects in each nucleus (abbreviations are as defined in Fig. 3) during one stimulus period is shown. The shaded area indicates the extent of the SEM over subjects. During the first half of each stimulus period, the subjects attended to the moving dot field. The hatched region indicates the second half of the stimulus period during which the subjects attended to the colored dot field.
