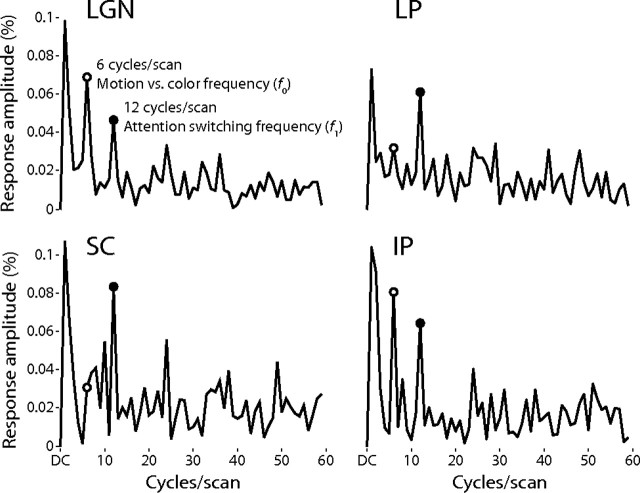
Figure 8.
Experiment 2 power spectra. Each graph shows the power spectra of the mean response across subjects in each ROI during experiment 2. The open circle marks the power at six cycles/scan, which was the fundamental frequency of the experiment, corresponding to the difference between the attention conditions. The closed circle marks 12 cycles/scan, which was the frequency of the switches between the attentional conditions.

