
Figure 1.
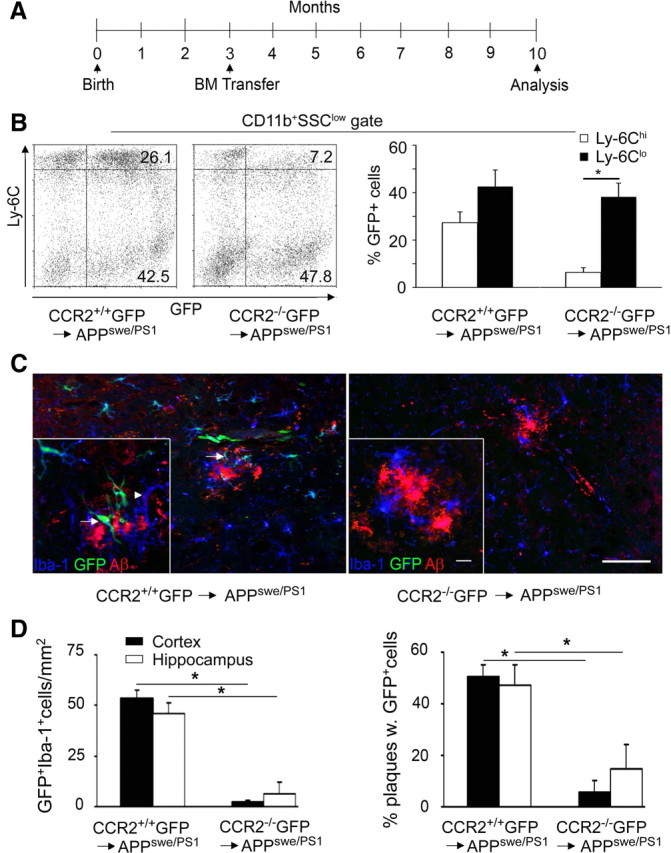
Engraftment of BM-derived phagocytes in the brains of AD transgenic mice depends on CCR2. A, Time scale of BM transfer experiments performed in APPswe/PS1 animals. Arrows mark the time points of generation and subsequent analysis of CCR2+/+GFP → APPswe/PS1 and CCR2−/−GFP → APPswe/PS1 chimeric mice. B, FACS analysis of peripheral blood 10 months after BM cell transfer reveals a lack of GFP+Ly-6Chi monocytes in CCR2−/−GFP → APPswe/PS1 chimeras compared with CCR2+/+ GFP donors. Percentages of the respective cell populations are indicated. Representative dot blots for the chimeric groups (left) and quantification of GFP+CD11b+Ly-6Chi and GFP+CD11b+Ly-6Clo cells (right) are shown. Data are expressed as means ± SEM. SSC, Side scatter. At least 5 mice per group were assessed. *p < 0.05 statistical significance. C, Immunohistochemistry of APPswe/PS1 BM chimeric brains. Fluorescence microscopy reveals a significant number of GFP-positive ramified cells in the hippocampus of CCR2+/+GFP → APPswe/PS1 mice (left), but very few in CCR2−/−GFP → APPswe/PS1 mice (right). Iba-1 immunoreactivity (blue) for phagocytes shows that some branched cells are GFP+ and therefore of donor origin (GFP, green, arrows), whereas others represent endogenous microglia expressing only Iba-1 (arrowheads). Immunostaining of β-amyloid is shown in red. Scale bars: 100 μm (overviews) and 25 μm (insets). D, Semiquantitative analysis of phagocyte engraftment (GFP+Iba-1+ cells) per area (left) and per β-amyloid plaque (right) in the hippocampus and cortex of BM chimeric animals. Bars show the means ± SEM from at least three sections per individual animal (n ≥ 5 per group). *p < 0.05 statistical significance.