Figure 2.

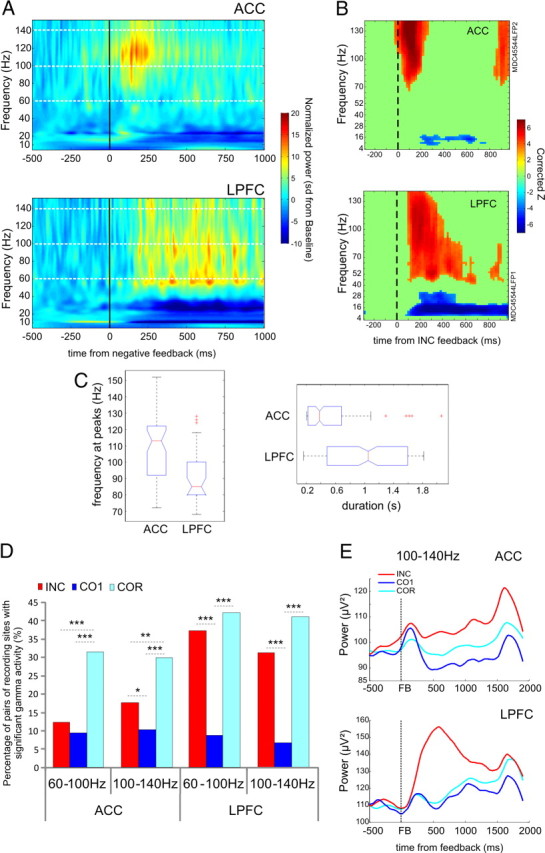
General description of high gamma oscillations. A, Average normalized power from 20 to 140 Hz from pairs of ACC and LPFC sites simultaneously recorded during incorrect trials. ACC, n = 14; LPFC, n = 7. B, Example of time frequency graph showing statistical change in activity compared with the baseline period (−500/−300 ms) before feedback (Wilcoxon and FDR). C, Boxplot of the frequency at peaks (left) and of the duration (right) of high gamma activations for recorded sites in ACC and LPFC after errors. The boxplots present the median (in red), the comparison intervals (notches), outliers (red crosses), box limits represent 25th and 75th percentiles, and whiskers give the +/−2.7σ interval. D, Proportion of sites with significant gamma power increase after feedback per frequency band. ACC: monkey M, n = 183 sites; monkey P, n = 61 sites; LPFC: monkey M, n = 76 sites; monkey P, n = 26 sites. Data are presented for two gamma bands: 60–100 Hz and 100–140 Hz. We observed more active sites in the repetition period than in the search period for the ACC and the same tendency in the LPFC for the INC and COR comparison. Activity linked to the CO1 was significantly less present in both regions for both frequency bands. The asterisks indicates the significance level: *p < 0.05, **p < 0.01, ***p < 0.001. E, Average raw activity (μV2) smoothed (rloess, 0.1) in the 100–140 Hz frequency band for the ACC (top, n = 244) and LPFC (bottom, n = 102) aligned on the three types of feedback (INC, red; CO1, light blue; COR, dark blue).
