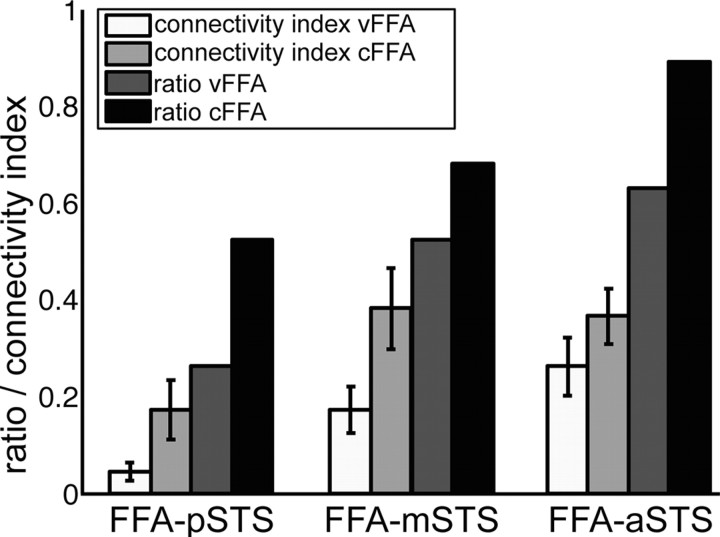
Figure 4.
Quantitative analyses of structural connections between FFA and STS regions. Seed and target regions were the face-sensitive region (vFFA, cFFA) and the voice-sensitive regions (posterior, middle, and anterior STS). Structural connectivity indices (white and light gray) were calculated for each connection in individuals (n = 19 participants; error bars show SEM). Structural connectivity index was defined as the number of connected voxels divided by the overall number of connected voxels per participant and by the number of voxels of seed and target regions (Eickhoff et al., 2010). The structural connectivity index was multiplied by 100 for a common display together with ratio values: The ratio (dark gray) shows the number of subjects who showed a connection normalized by the number of all participants (n = 19).

