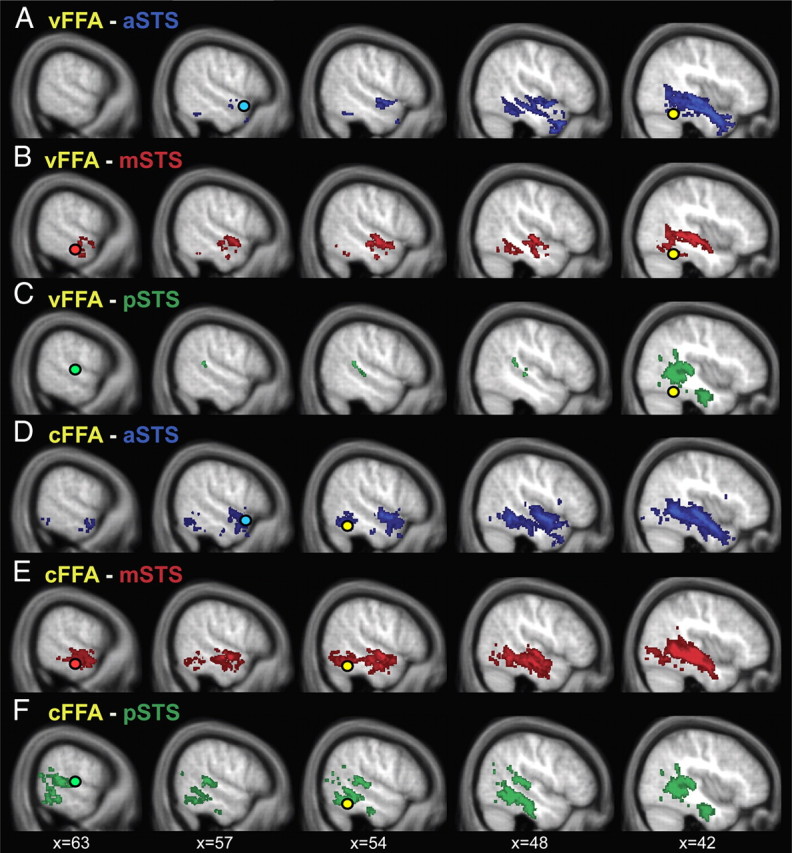
Figure 5.

Group overlay of probabilistic pathways between voice-sensitive STS and face-sensitive FFA. Connectivity distributions of 19 participants' dMRI data were binarized, thresholded at 10 paths per voxel at the individual subject level, and overlaid for display purposes. There are connections between the FFA (yellow circle) and the anterior part of the STS (blue circle; A, D), the middle part of the STS (red circle; B, E), and the posterior part of the STS (green circle, C, F). The connectivity distributions are colored correspondingly to the STS seed and target masks. A–C, Tracking results for FFA localized with the visual localizer. D–F, FFA localized with the auditory localizer. Tracking results are depicted on the averaged T1 scan of the 19 subjects.
