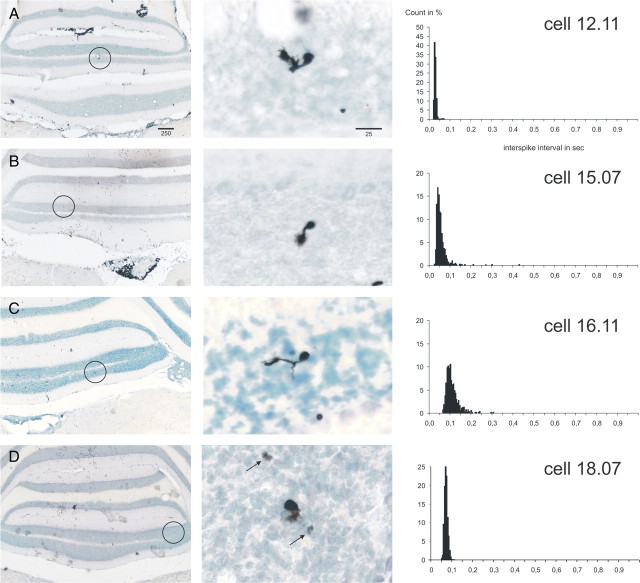
Figure 2.
Juxtacellularly labeled rat UB cells with the ISI histograms of their respective spontaneous activity. A–D show four representative UB cells from the vestibulocerebellum. The format is like that of Figure 1. Note that, in general, the shape of the ISI distribution is very narrow (A, D) but that it may also have a slight rightward tail (B, C). The arrows in the middle panel of D point to labeled mossy fiber-like rosettes of the axon of the labeled UB cell. Some cells were also shown in the study by Simpson et al. (2005).

