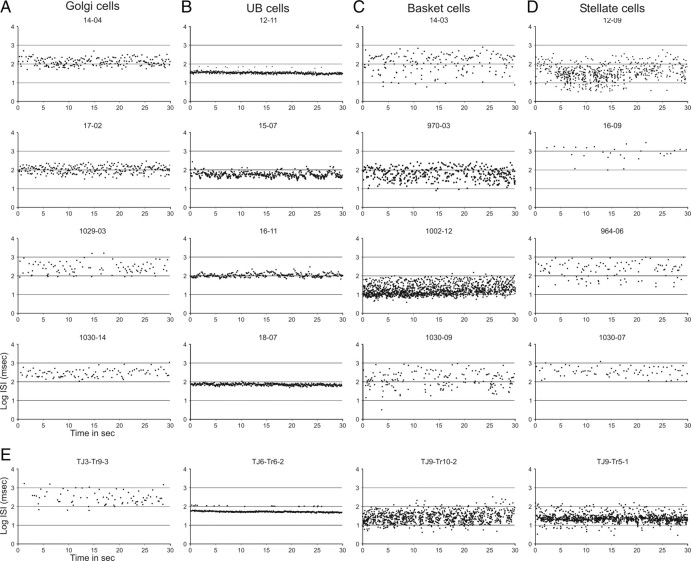
Figure 5.
The temporal firing pattern examined by plotting successive ISIs against time. A–D show the successive ISIs for 30 s of spontaneous activity of the Golgi cells shown in Figure 1 (A), the UB cells shown in Figure 2 (B), the basket cells shown in Figure 3 (C), and the stellate cells shown in Figure 4 (D). Intervals are indicated as the log10 of the intervals in milliseconds. Note that the distribution of ISIs for the Golgi cells is mostly found between 2 and 3 on the log10 scale (A), whereas for the UB cells it is much narrower (less than one-half a log10 unit: B). Both basket (C) and stellate (D) cells have a wider distribution usually exceeding one log10 unit. Although some cells from different classes may show rather similar temporal distributions (compare bottom panels of A and D), they can be distinguished using other measures of the spontaneous firing pattern (compare Fig. 8). E, Temporal plots of the successive ISIs of the four identified rabbit cells shown in Figure 6. Note that, in general, the pattern is quite similar to that found for the rat cells of the same class.

