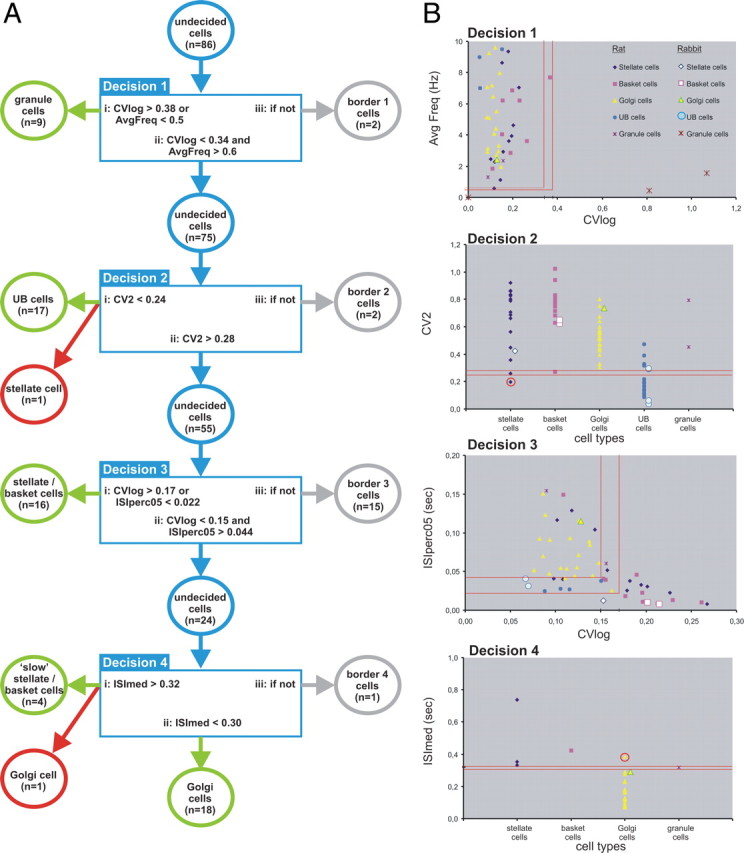
Figure 8.

The decision process based on selected statistical measures of spontaneous activity and the relation to morphologically identified interneurons in the rat and rabbit (n = 86 cells). A, Diagram of the four successive decision steps used to discriminate in sequential order granule cells, UB cells, basket/stellate cells, and, finally, slow basket/stellate cells from Golgi cells. Sixty-four cells were correctly identified by the algorithm (indicated by the green circles). Two cells were wrongly classified (red circles; also in B). The border categories are included in the decision process to reduce the number of misclassified cells; 20 cells fell into border categories (gray circles). See text for additional explanation. B, Diagrams showing graphically the values of the relevant measures used at each step in the decision process. The top diagram (labeled “Decision 1”) includes all cells as well as identification of the various symbols in relation to the different cell classes. The rabbit granule cell symbol at (0, 0) represents three rabbit and four rat granule cells. In the sequential diagrams (Decisions 2, 3, and 4), the cells on which no decision was made to include them into either a particular class or the border category in the previous decision step are shown. Note that, in the top panel (Decision 1), the cells with average frequencies exceeding 10 Hz are not plotted. However, all these cells also had a CVlog value <0.34 and thus were carried to the next decision step (Decision 2). See text for additional explanation.
