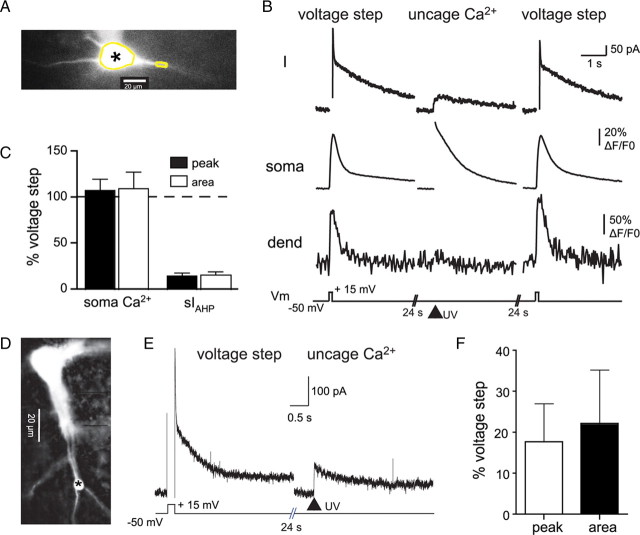
Figure 3.
Somatically restricted calcium rises fail to reproduce the sIAHP. A, Green fluorescence image of a BLA neuron filled with the calcium indicator Oregon Green BAPTA-1, together with the photosensitive calcium buffer DM-Nitrophen (2 mm). Yellow boxes indicate the somatic and the dendritic regions of interest. * indicates the position of the UV uncaging spot. B, The whole-cell current and calcium response to a 200 ms, 65 mV voltage step from a holding potential of −50 mV bracketing (left and right traces) the response to a flash of UV laser light directed at the soma (middle traces). The arrowhead indicates the timing of the UV laser pulse (10 ms, 20 mW) used to uncage calcium in the soma. The artifact caused by the UV laser was removed from the calcium traces. C, Summary data showing the amplitude (500 ms; white bars) and the integrated area (0.5–3 s; black bars) of the sIAHP current and calcium response evoked by photorelease of calcium in the soma, normalized to the response evoked by a voltage step (n = 11). D, Fluorescence image of the BLA neuron in which the UV laser was directed at a segment of dendrite 90 μm from the soma. * indicates the position of the UV uncaging spot. E, An example of the sIAHP current evoked by photolytic uncaging of calcium (left traces) in the dendrite of the neuron shown in D. The current trace is the average response evoked by six UV stimulations. The current evoked by a voltage step in this neuron is shown on the left. F, Summary data showing the amplitude (500 ms; white bars) and the integrated area (0.5–3 s) of the sIAHP current evoked by photorelease of calcium in the dendrite (70–100 μm from the soma), normalized to the response evoked by a voltage step (n = 5).

