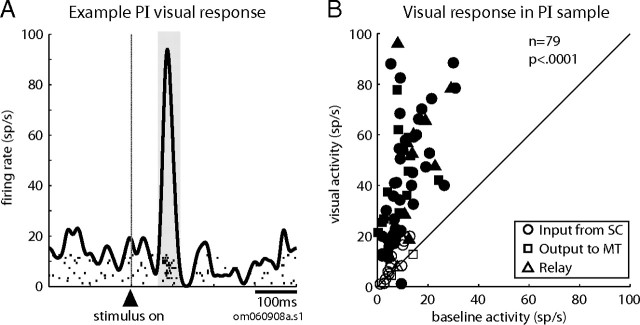
Figure 3.
PI neurons in the ascending SC-to-MT pathway have strong phasic visual responses. A, Spike density function of the visual response of an example relay neuron. Data are aligned on the visual stimulus onset (vertical line), rasters show action potentials on individual trials, and the shaded region indicates the 50 ms window used to calculate the average visual activity for the sample of neurons shown in B. The spike density function is smoothed with an 8 ms Gaussian kernel. B, Average visual responses (y-axis) are plotted against average prestimulus baseline activity (x-axis) for the sample of neurons with input from SC and/or output to MT. Each data point represents a single neuron. The symbols denote the connectivity of the neuron (see legend), and the filled symbols indicate a significant difference between the visual response and baseline activity of the individual neuron (paired t test, p < 0.05).

