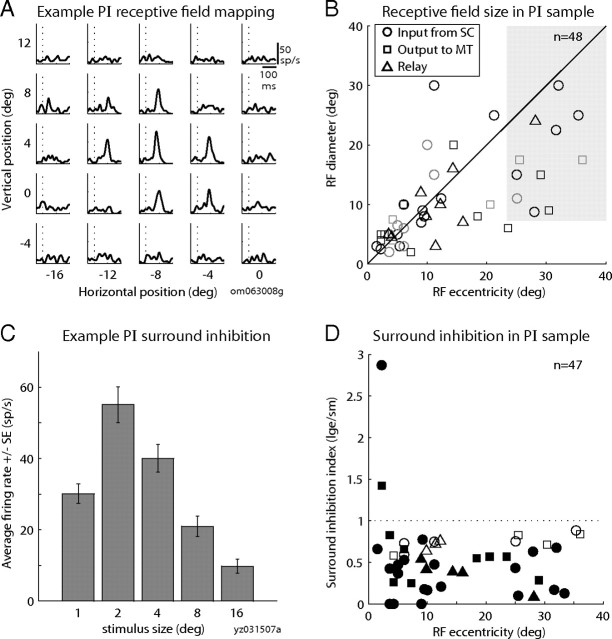
Figure 4.
Receptive field structure of PI neurons in the ascending path. A, RF mapping for an example relay neuron. Each panel shows the spike density function of the visual responses for one of 25 locations in a 5 × 5 grid. Data are aligned on stimulus onset (dotted vertical line). B, Relationship between RF eccentricity (x-axis) and RF diameter (y-axis) in the sample of PI neurons. Symbol color indicates the mapping method (black, automated; gray, manual) and the shaded region indicates large-eccentricity fields that could not be fully mapped. C, Surround inhibition in an example neuron that received input from SC. Bars show the average response (±SE; y-axis) to visual stimuli of varying diameter (x-axis). D, Surround inhibition in the sample of neurons. Graph shows the surround inhibition index (response to largest stimulus size/response to optimal small stimulus, y-axis) as a function of RF eccentricity (x-axis).

