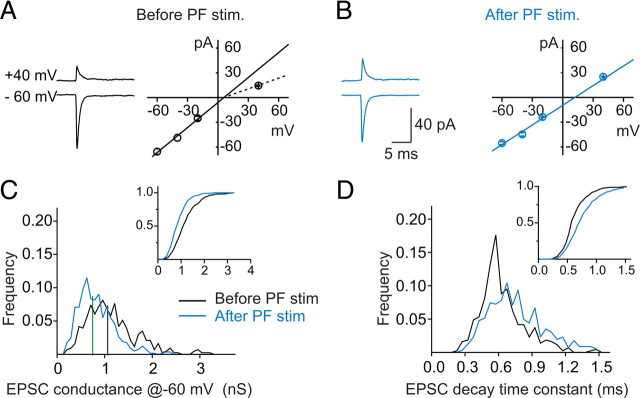
Figure 3.
Theta-burst stimulation of parallel fibers induced a switch in AMPAR phenotype. A, B, Examples of average EPSC traces and I–V plots before (A) and after (B) stimulation show a decrease in AMPAR rectification, indicating a switch of synaptic AMPARs from GluR2-lacking (GluR2−) to GluR2-containing (GluR2+) receptors. C, Relative distribution of EPSC conductance amplitudes at −60 mV before and after stimulation (before stimulation, 429 synaptic events; after stimulation, 562 events; n = 5 cells). Inset, Cumulative distribution of amplitudes [median: −62.8 pA before (black line), −46.1 pA after (green line); p < 0.00001, Kolmogorov–Smirnov test]. D, Distribution of sEPSC decay time constant at −60 mV before and after the stimulation (median: 0.59 ms before, 0.73 ms after; p < 0.0001, Kolmogorov–Smirnov test).

