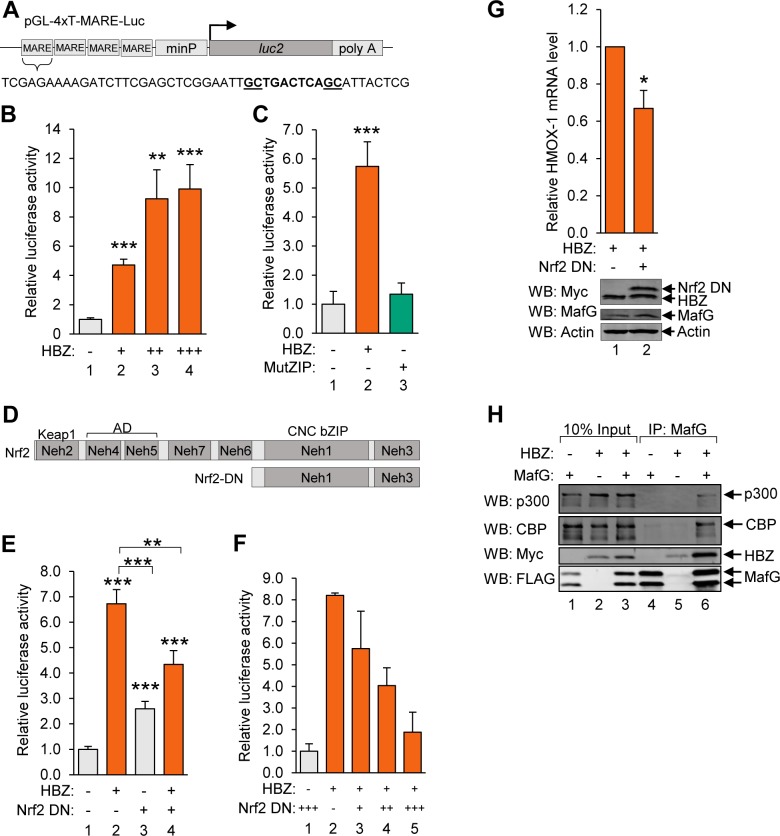
Fig 7. HBZ/small Maf heterodimers activate transcription from T-MAREs.
(A) The schematic shows the pGL-4xT-MARE-Luc plasmid used in reporter assays. Four tandem repeat sequences containing a T-MARE were cloned into pGL4.26 upstream of the minimal promoter (minP). (B) HBZ activates transcription from T-MAREs. Jurkat cells were co-transfected with increasing amounts of pSG-HBZ-Myc and with pGL4.26 or PGL-4xT-MARE-Luc. The graph shows data calculated by subtracting pGL4.26 luminescence values from expression-matched pGL-4xT-MARE-Luc luminescence values. Data are an average of two independent experiments, each of which was performed in triplicate. Error bars represent SEM (two-tailed Student’s t-test, **p≤0.01, ***p≤0.001). (C) HBZ activates transcription from T-MAREs, which is dependent on the ZIP domain. Jurkat cells were co-transfected with pSG-HBZ-Myc or pSG-HBZ-MutZIP and pGL4.26 or pGL-4xT-MARE-Luc. The graph shows data calculated by subtracting pGL4.26 luminescence values from expression vector-matched pGL-4xT-MARE-Luc luminescence values. Data are an average of three independent experiments, each of which was performed in triplicate. Error bars represent SEM (two-tailed Student’s t-test, ***p≤0.001). (D) The schematic shows full-length Nrf2 with its characterized domains and the region of Nrf2 comprising the dominant negative deletion mutant (Nrf2 DN). The Keap1 binding site, activation domain (AD) and Cap’n’Collar (CNC) bZIP domain encompass Nrf2-ECH homology domain 2 (Neh2), Neh4/5 and Neh1, respectively. (E) A dominant negative mutant of Nrf2 suppresses HBZ-mediated transcriptional activation from T-MAREs. Jurkat cells were co-transfected with pSG-HBZ-Myc and/or pcDNA-Nrf2-DN-Myc and pGL4.26 or pGL-4xT-MARE-Luc. The graph shows data calculated by subtracting pGL4.26 luminescence values from expression vector-matched pGL-4xT-MARE-Luc luminescence values. Data are an average of three independent experiments, each of which was in performed in triplicate. Error bars represent SEM (two-tailed Student’s t-test, **p≤0.01, ***p≤0.001). (F) Jurkat cells were co-transfected with pSG-HBZ-Myc, increasing amounts of pcDNA-Nrf2-DN-Myc, and pGL4.26 or pGL-4xT-MARE-Luc. The graph shows data calculated by subtracting pGL4.26 luminescence values from expression vector-matched pGL-4xT-MARE-Luc luminescence values. Data shown are representative of three independent experiments, each performed in triplicate. Error bars represent standard deviation. (G) A dominant negative mutant of Nrf2 suppresses transcription of endogenous HMOX1 in Hela cells stably expressing HBZ. HeLa cells stably expressing HBZ-Myc-His were transfected with pMACS CD4 and pcDNA or pcDNA-Nrf2-DN-Myc. Successfully transfected cells were isolated according to ectopic expression of the CD4 surface marker and aliquoted for RNA extraction and, separately, whole cell extract preparation. Relative mRNA levels in control- and Nrf2-DN-transfected cells were quantified by qRT-PCR. Levels of the indicated proteins in 40 μg of whole cell extract were evaluated by Western blot using the antibodies indicated. qRT-PCR data are an average of four independent experiments. Error bars represent SEM (two-tailed Student’s t-test, *p≤0.05). (H) HBZ modulates binding of p300/CBP to HBZ/small Maf complexes. HEK 293T cells were transfected with 1 μg pCMV-MafG-FLAG and/or 6 μg pcDNA-HBZ-Myc-His as indicated (adjust to 12 μg with the empty vectors). Proteins were immunoprecipitated using an anti-FLAG antibody to bind MafG. Immunoprecipitates and 10% the whole cell extract inputs were analyzed by Western blot using the antibodies indicated.

